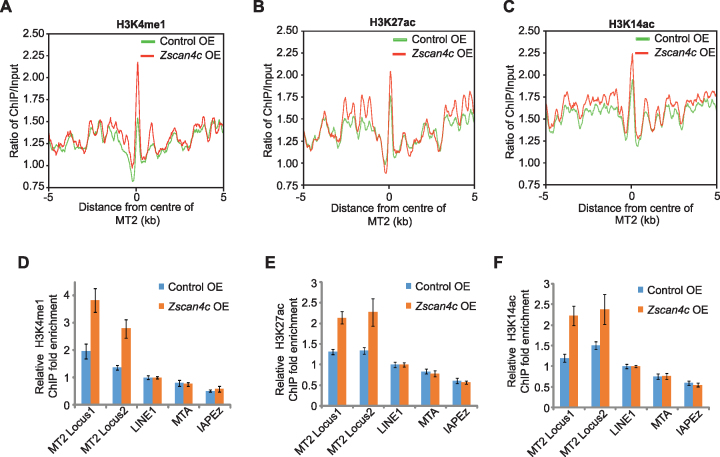
Figure 6.
Epigenetic regulation of MT2/MERVL after Zscan4c overexpression. (A–C) H3K4me1 (A), H3K27ac (B), and H3K14ac (C) profile plot around the centre of MT2 sequences in control ESCs (Control OE) and Zscan4c-overexpressed ESCs (Zscan4c OE). The ChIP-seq signal was calculated as the ratio of normalized reads relative to input. (D–F) ChIP-qPCR analysis of H3K4me1 (D), H3K27ac (E) and H3K14ac (F) enrichment on specific locus of MT2 in control ESCs and Zscan4c-overexpressed ESCs. LINE1, MTA and IAPEz were included as control. ChIP-qPCR data was normalized to input and that of LINE1. Biological-triplicate data (n = 3 extracts) are presented as mean ± s.e.m.

