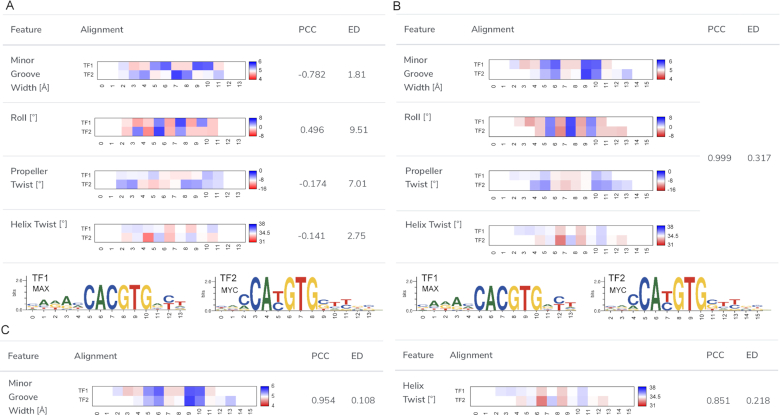
Figure 4.
An example for a TFBSshape comparison of DNA shape preferences of two TFBS datasets using the shape alignment function. (A) The user can select the shape features used for calculating the best alignment from the checkbox at the shape alignment interface. Before the shape alignment, the comparison of the homologous TFs MAX from human (MA0058.1) and MYC from mouse (MA0147.2) from JASPAR demonstrates low Pearson correlation coefficients (PCCs) and large Euclidean distances (EDs) due to the poor alignment. The corresponding sequence motif logos with nucleotide positions numbered according to the alignment for the two TFs are shown in the bottom panel. (B) In this example, four shape features, including HelT, MGW, ProT and Roll, were selected. Using the chosen shape features, the best alignment was calculated and the average heat maps as well as the corresponding PCC and ED for the four DNA shape features are shown. Compared to the initial alignment, this shape alignment is a significant improvement in terms of PCC and ED. (C) The shape alignment tool can be used to compare the similarity between two TFs referring to different shape features. For example, the similarity for MGW is higher than the one for HelT.

