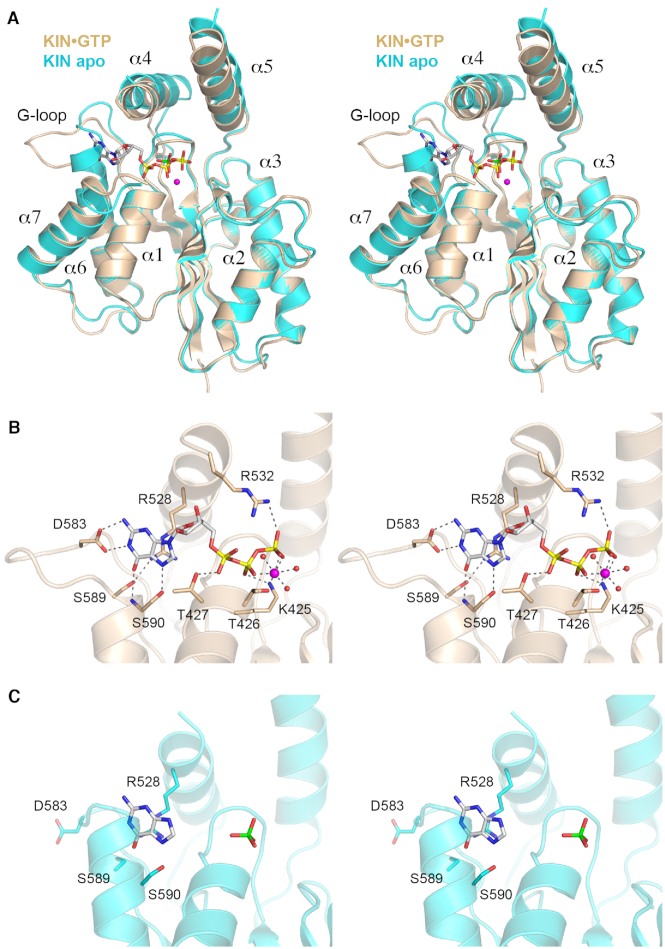
Figure 4.
Structures of the KIN•GTP•Mg2+ complex and KIN apoenzyme. (A) Stereo view of the superimposed tertiary structures of the KIN•GTP•Mg2+ complex (colored gold) and the KIN apoenzyme (colored cyan). The seven α helices flanking the central β sheet are numbered sequentially. GDP is depicted as a stick model with yellow phosphorus atoms. Magnesium is depicted as a magenta sphere. The phosphate anion in the KIN apoenzyme is shown as a stick model with a green phosphorus atom. (B) Stereo view of the KIN active site highlighting interactions with GTP•Mg2+. Amino acids are shown as stick models with beige carbons. Magnesium and waters are denoted by magenta and red spheres, respectively. Atomic contacts are indicated by dashed lines. (C) Stereo view of the equivalent active site region of the KIN apoenzyme, highlighting a conformational switch in the G-loop segment.

