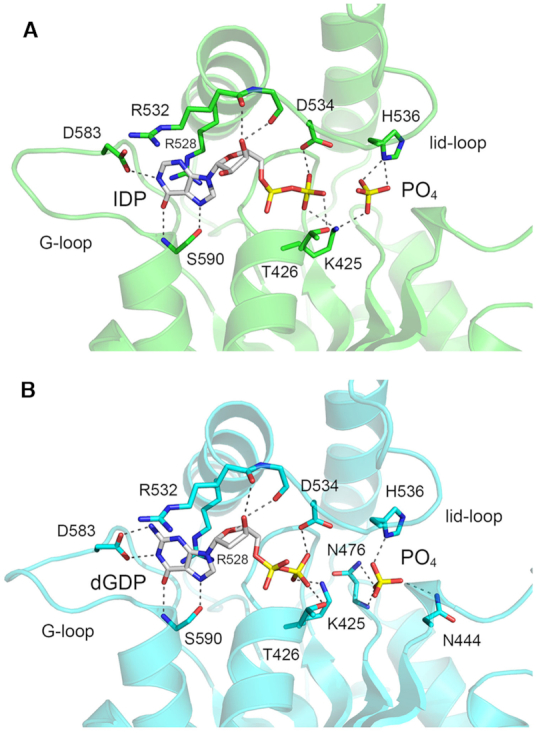
Figure 5.

Structures of KIN in complexes with IDP and dGDP. The atomic interactions with IDP (panel A; KIN domain colored green) and dGDP (panel B; KIN domain colored cyan) and phosphate anions near the nucleotide β phosphates are indicated by dashed lines. The lid-loop is visible in both structures.
