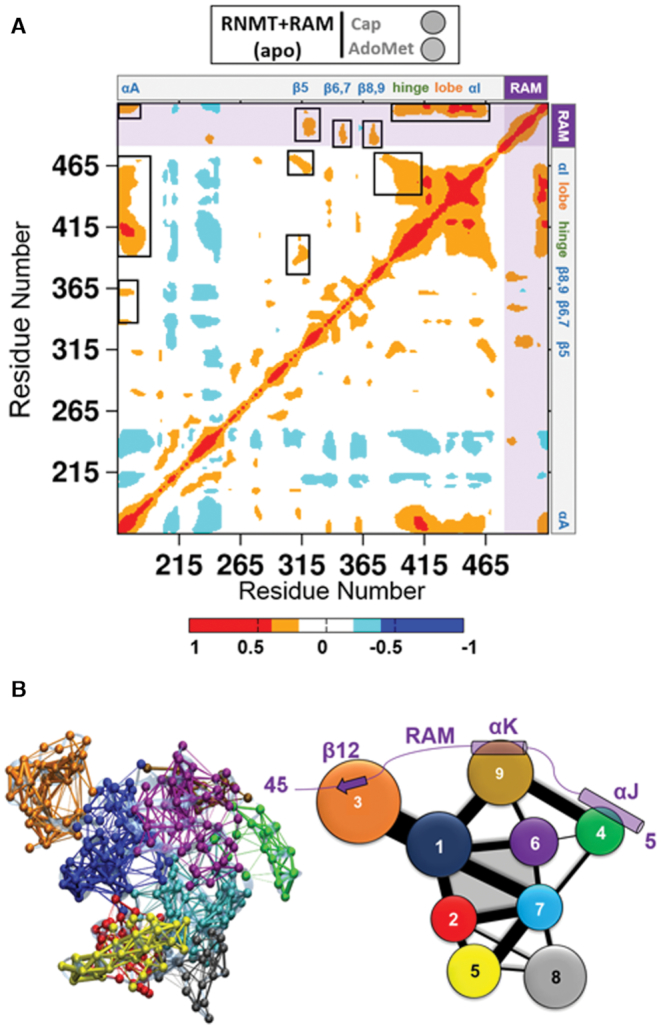
Figure 7.

Allosteric networks in the RNMT–RAM complex. (A) Inter-residue cross-correlation plot calculated for the apo-RNMT-RAM complex. Correlations range from −1 (anti-correlated, blue) to +1 (correlated, red). Positions of the key structural elements of RNMT are indicated at the top and right. RAM is included after the RNMT C-terminus and is highlighted by shading. Strong cross-correlations that affect the RNMT active site are highlighted in black boxes in the upper triangle. (B) All-residue dynamic network and coarse-grained community analysis of the RNMT–RAM complex. Left: The all-residue dynamic network representation with points (‘nodes’) representing protein residues. The nodes are connected by the ‘edges’ if they are found to be within 4.5 Å of each other for at least 75% of the aMD trajectory. In addition, the nodes are coloured according to the communities they belong to. Right: 2D community diagram of RNMT–RAM. Each community is shown as a coloured circle, with a radius proportional to the size of the community (i.e. number of residues). The communities that were found to interact with each other are connected by edges, with the width of an edge proportional to intercommunity interaction strength. The active site is formed by the communities 1, 2, 6 and 7 and is shaded in grey.
