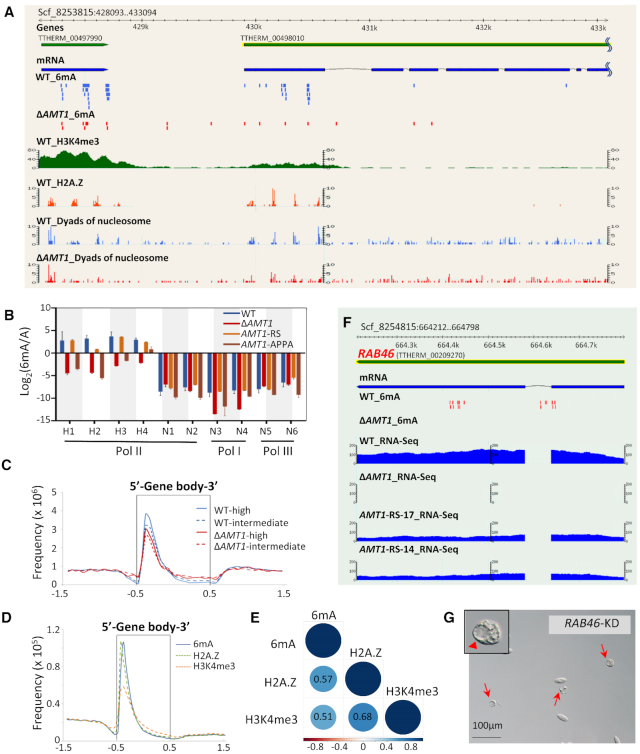
Figure 5.
AMT1 affects Pol II-transcribed genes. (A) Distributions of 6mA, H3K4me3, H2A.Z, and nucleosomes. In this GBrowse snapshot of a representative genomic region, tracks from top to bottom are: gene models, mRNA transcripts, 6mA (WT in blue, ΔAMT1 in red), H3K4me3 (X-ChIP coverage), dyads of nucleosomes containing H2A.Z, and dyads of nucleosomes (WT in blue, ΔAMT1 in red). Note the biased distribution of 6mA toward the 5′ end of a long gene (TTHERM_00498010). (B) Validating the methylation states of 10 GATC sites by DpnI/DpnII digestion. The sites were selected for their location on genes transcribed by different RNA polymerases (Pol I, II and III), and their methylation levels calculated from SMRT sequencing data (H1-H4: high methylation; N1-N6: no methylation; all in WT cells). Genomic DNA was digested with DpnI or DpnII; qPCR was performed with primers flanking the GATC sites to quantify undigested DNA (Supplementary Table S6). Y-axis represents the ratios between the methylated and unmethylated state (Log2 transformed), deduced from differential digestion by DpnI and DpnII. See Materials and Methods for details. (C) Composite analysis of 6mA distribution on the gene body of WT (blue) and ΔAMT1 cells (red). Genes are scaled to unit length and is extended to each side by unit length. Distribution frequency was calculated as ‘6mA amount at a certain position/total 6mA amount’. Solid lines: high methylation levels (80–100%); dashed lines: intermediate methylation levels (20–80%). Note that the remaining 6mA in ΔAMT1 cells was similarly accumulated downstream of transcription start sites (TSS), towards the 5′ end of the gene body. (D) Distribution profiles of 6mA, H2A.Z, H3K4me3 on the gene body of WT cells. Genes are scaled to unit length and is extended to each side by unit length. Note that all of them were accumulated downstream of TSS, towards the 5′ end of the gene body. (E) Correlation matrix of H2A.Z, H3K4me3, and 6mA frequency in 1 kb of the gene body downstream of TSS. Correlation coefficients and correlation color dots are shown. (F) GBrowse snapshot of the RAB46 locus (TTHERM_00209270). Tracks from top to bottom are: gene model, mRNA transcripts, 6mA (WT and ΔAMT1 cells), and RNA-seq coverage in WT, ΔAMT1 and AMT1-RS cells (two replicates, AMT1-RS-17 and AMT1-RS-14). Note that both 6mA and RAB46 expression were eliminated in ΔAMT1 cells. (G) Extraordinarily large contractile vacuoles (CV) were observed upon RAB46 knockdown (KD). Red arrowheads: large CV; red arrows: cells with large CV.

