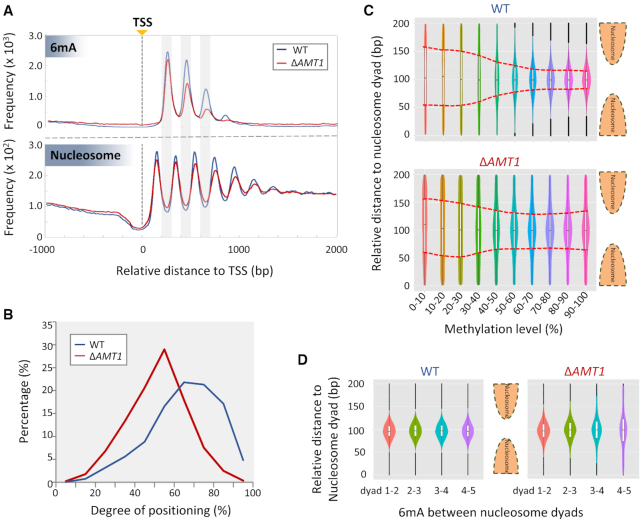
Figure 6.
Attenuation of strong 6mA and nucleosome positioning relative to each other in ΔAMT1 cells. (A) Distribution profiles of 6mA (top panel) and nucleosome (bottom panel) around TSS in WT (blue) and ΔAMT1 cells (red). (B) Nucleosome positioning in WT (blue) and ΔAMT1 (red) cells. Degrees of positioning were calculated for +1, +2 and +3 nucleosomes in the gene body. See Materials and Methods for details. (C) 6mA distribution relative to the nucleosome dyad in WT (top panel) and ΔAMT1 cells (bottom panel). The violin plots show the density of 6mA between neighboring nucleosome dyads, grouped by methylation levels. The box plots within represent the median and the interquartile range of each group. Red dotted lines mark the trend for 6mA with high methylation levels to be enriched in linker DNA in WT (top panel) but not ΔAMT1 cells (bottom panel). (D) Dispersions of 6mA increase further downstream of TSS in ΔAMT1 cells (right panel) but not WT cells (left panel). The violin/box plots show 6mA distribution between neighboring nucleosomes, grouped by their positions in the gene body (+1/+2, +2/+3, +3/+4, +4/+5).

