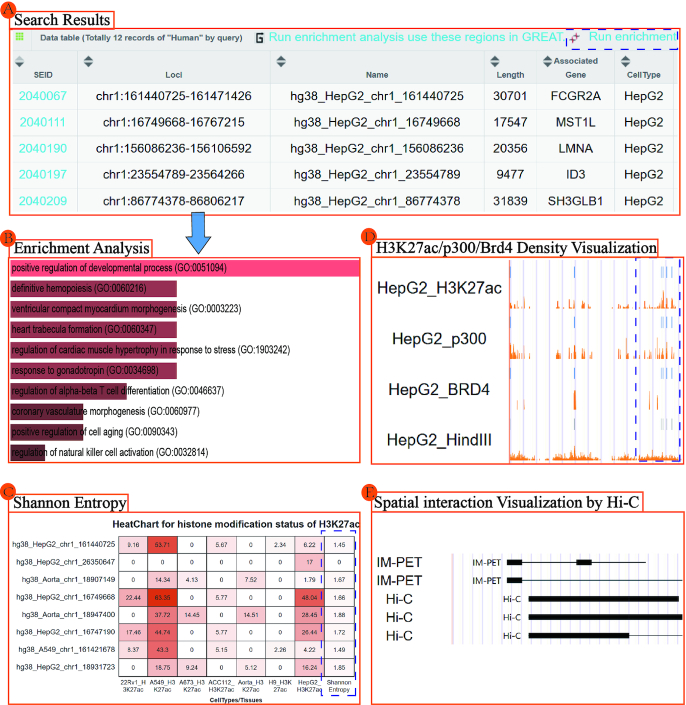
Figure 3.
A case application showing select SEA v. 3.0 features. (A) Super-enhancers with related coding genes computationally recognized by p300 in chromosome 1 of the human HepG2 cell line. (B) Enrichment analysis of super-enhancer related genes through the Enrichr interface. (C) Cell type specificity of super-enhancers computed by Shannon Entropy. (D) H3K27ac, p300 and Brd4 density of HepG2 super-enhancers visualized in the genome browser. (E) Spatial interaction visualization by Hi-C in the genome region ‘chr1:156864585–156975979’.

