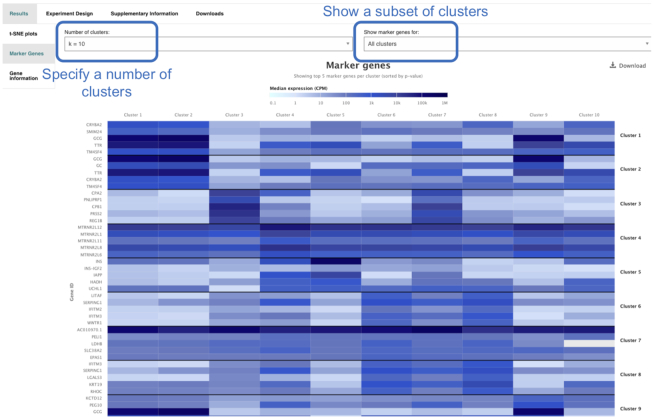
Figure 4.
Screenshot of a heatmap showing the average expression of ‘marker genes’ within each cell cluster of a single study as shown in https://www.ebi.ac.uk/gxa/sc/experiments/E-GEOD-81547/results/tsne?geneId=ENSG00000172023&colourBy=metadata&metadata=inferred_cell_type&markerGeneK=10.

