
Figure 1.
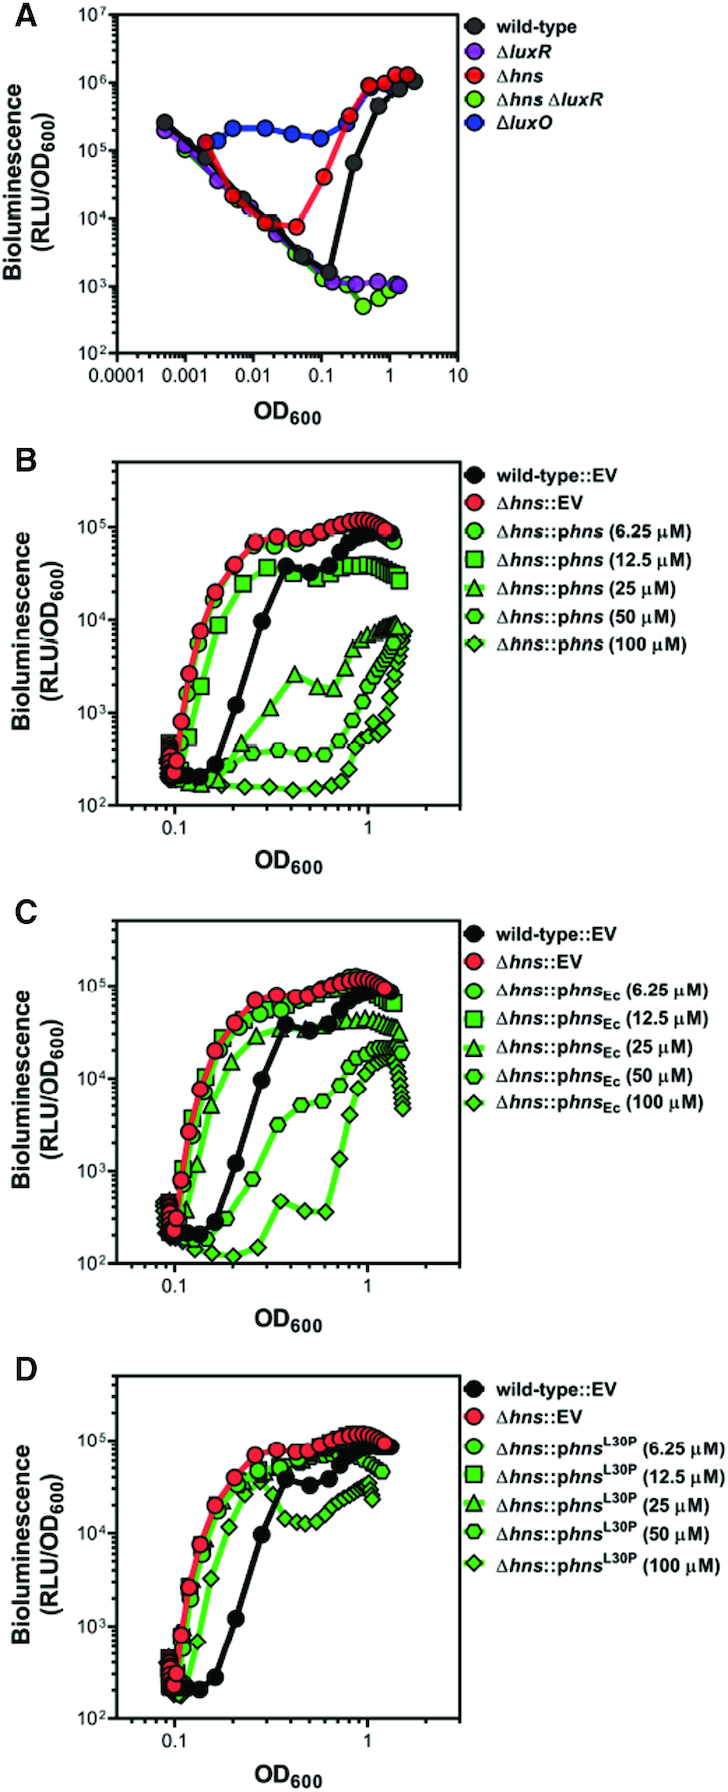
H-NS controls bioluminescence in V. harveyi and is functionally similar to H-NS in E. coli. (A) Bioluminescence (relative light units, RLU; Lux/OD600) was measured for V. harveyi wild-type (BB120), ΔluxR (KM669), Δhns (RRC045), Δhns ΔluxR (RRC168) and ΔluxO (JAF78). Data shown are three independent biological experiments. (B–D) Bioluminescence (relative light units, RLU; Lux/OD600) was measured for V. harveyi wild-type (BB120) and Δhns (RRC045) strains. Strains contained either an empty vector (EV, pMMB67EH-kanR), a plasmid expressing V. harveyi hns under an IPTG-inducible promoter (pRC053; panel B), a plasmid expressing E. coli hns under an IPTG-inducible promoter (pRC054; panel C), or a plasmid expressing V. harveyi hns L30P under an IPTG-inducible promoter (pRC055; panel D). IPTG was added at concentrations of 6.25 μM, 12.5 μM, 25 μM, or 50 μM; IPTG concentration had no effect on the curve for the wild-type EV or Δhns EV strains (data not shown). Data shown are averages of two technical replicates and are representative of five independent biological experiments.