Figure 2.

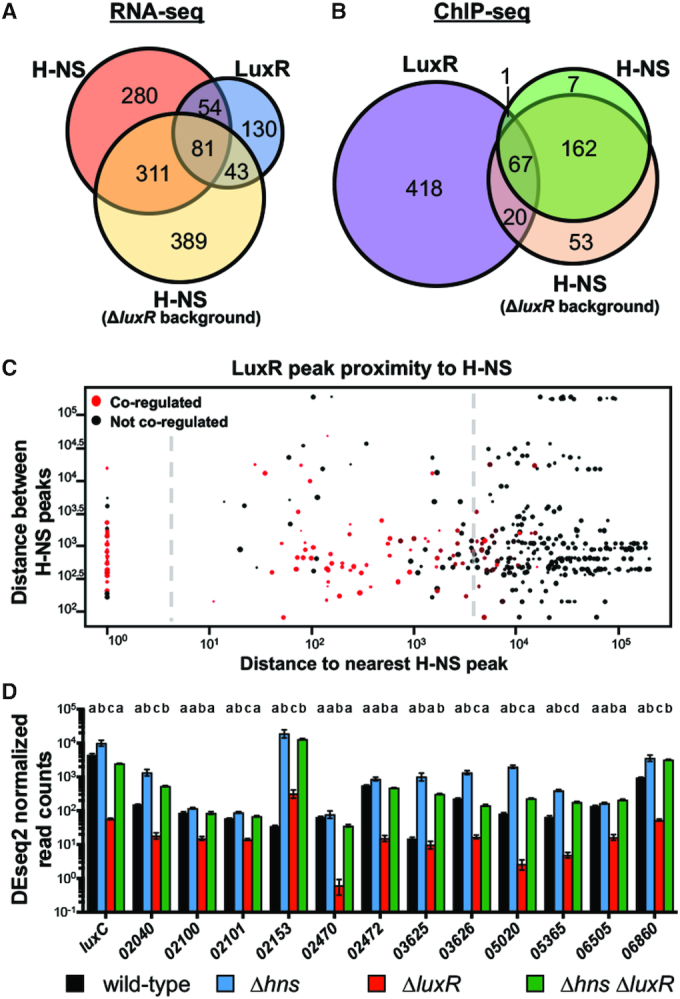
LuxR and H-NS directly co-regulate QS genes. (A) RNA-seq was used to determine genes regulated >2-fold, P < 0.05. The H-NS regulon was determined by comparing transcript levels of a ΔluxR strain (KM669) to a Δhns ΔluxR strain (RRC168). The LuxR regulon was previously determined by comparing wild-type (BB120) to a ΔluxR strain (KM669) (7). (B) FLAG-LuxR and H-NS-FLAG ChIP-seq profiles were analyzed for overlapping peaks within 500bp. The H-NS-FLAG ChIP-seq profile was determined in the ΔluxR background (RRC237), and the FLAG-LuxR ChIP-seq profile was determined in a wild-type background (JV039). (C) Each point represents a LuxR binding site with the diameter corresponding to the strength of the peak at that site; all 506 LuxR peaks are plotted. The distance between a LuxR peak and the nearest H-NS peak is plotted on the x-axis. The distance between the nearest H-NS peak and the next proximal H-NS peak is plotted on the y-axis. Red points represent LuxR peaks that are proximal to genes that are co-regulated by LuxR and H-NS while black points represent genes that are regulated by only one protein or neither. The plot is divided into three segments by the dashed line that represent LuxR peaks that overlap with H-NS peaks (left), LuxR peaks that are proximal to H-NS peaks (middle), and LuxR peaks that are not associated with H-NS peaks (right). (D) DESeq2 normalized read counts determined by RNA-seq of RNA collected from wild-type (BB120), ΔluxR (KM669), Δhns (RRC045), Δhns ΔluxR (RRC168) V. harveyi strains. V. harveyi locus tags are listed on the x-axis (VIBHAR_XXXXX). Different letters indicate significant differences between strains (P < 0.05; two-way analysis of variation (ANOVA), followed by Tukey's multiple comparison test of log-transformed data; n = 3).
