
Figure 3.
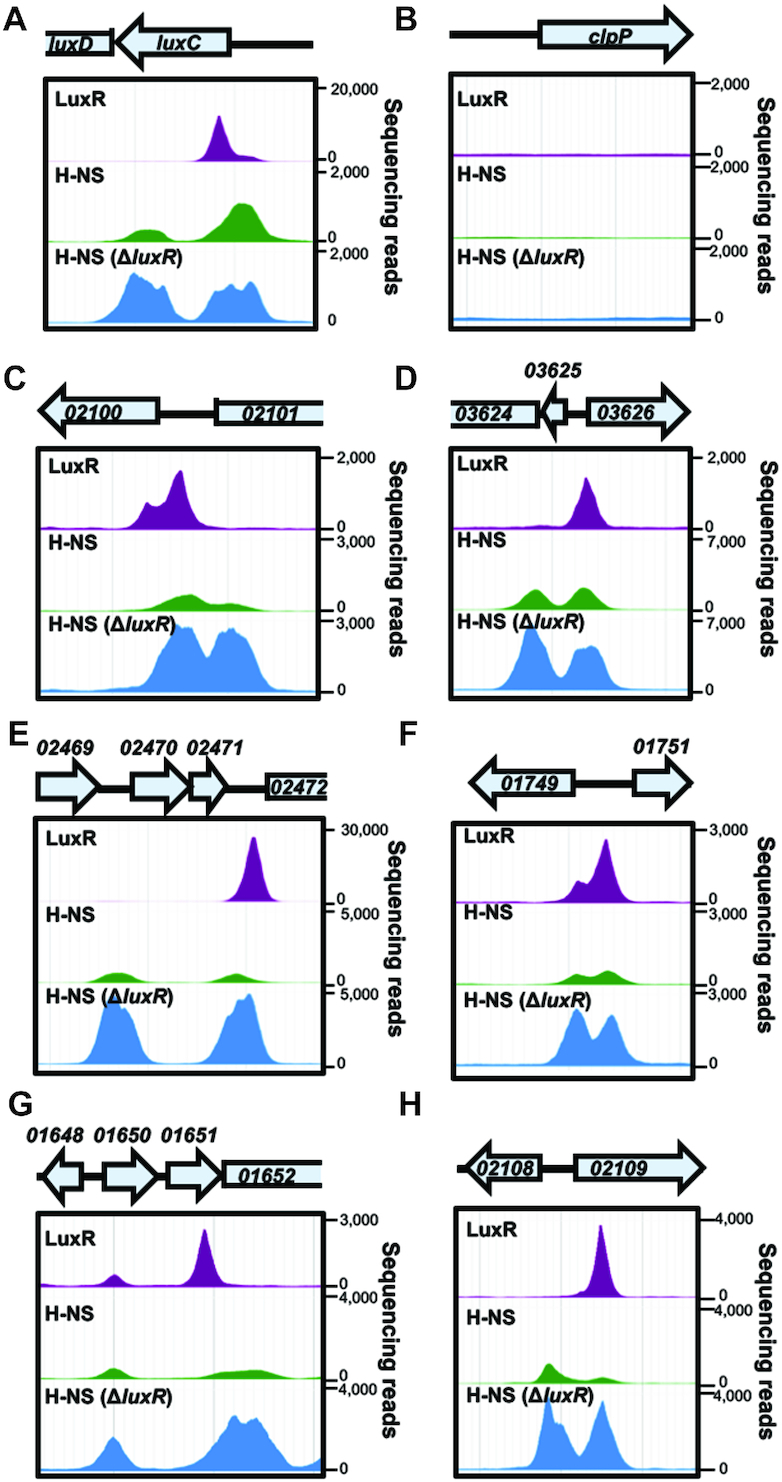
LuxR and H-NS binding peak distribution. (A–H) LuxR and H-NS ChIP-seq peaks at QS loci luxC, VIBHAR_02100, 03626, 02472, 01749, 01652and 02108 are shown for experiments in which LuxR (JV039) or H-NS (RRC169) were ChIPed in the wild-type background (top two rows for each panel) or in the ΔluxR background (RRC237, bottom row for each panel). ChIP-seq profiles were visualized using JBrowse 1.12.3.