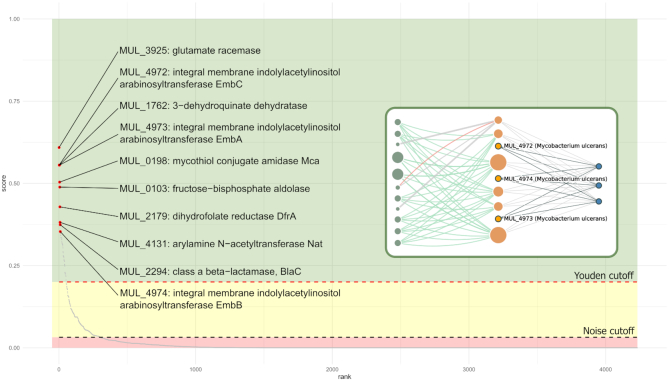
Figure 6.
Network-driven whole-genome target prioritization for Mycobacterium ulcerans: Candidate targets in the M. ulcerans genome were ranked by their NDS (network druggability score, see main text). The plot depicts all genome targets (in the x axis) along with their corresponding NDS score (in the y axis). Red points correspond to the top-10 ranked targets, with labels indicating the gene name and product. Browsing whole-genome prioritization from the data summary, the user may access a gene page by clicking on it in the prioritization plot. A subgraph example from EmbA/EmbB/EmbC gene family is shown (as seen in their corresponding gene pages). The figure also displays confidence zones, DG1 (red): delimited by zero and noise cutoff; DG2 (yellow): between the noise and the Youden cutoff; and DG3–5: with scores higher than the Youden cutoff.

