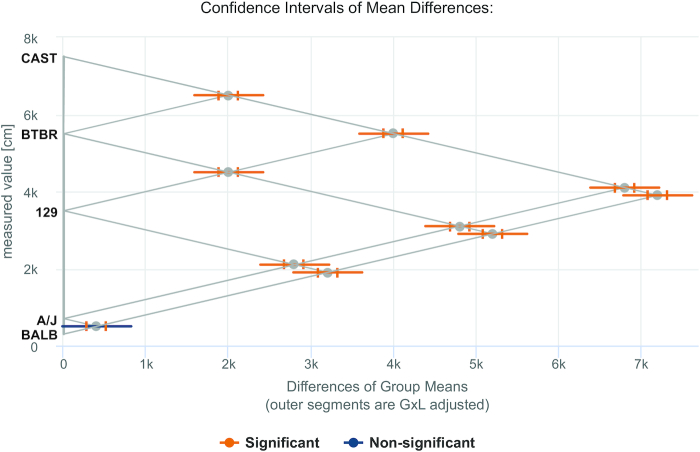
Figure 4.
GxL Replicability Adjuster Tool: Comparison Plot. Differences of strain means are plotted for pairwise comparisons (see abbreviated strain name along the y-axis). Inner segments are unadjusted confidence intervals while the outer segments indicate the GxL adjusted confidence intervals. Orange indicates significant results (P≤ 0.05) while blue indicates non-significant.

