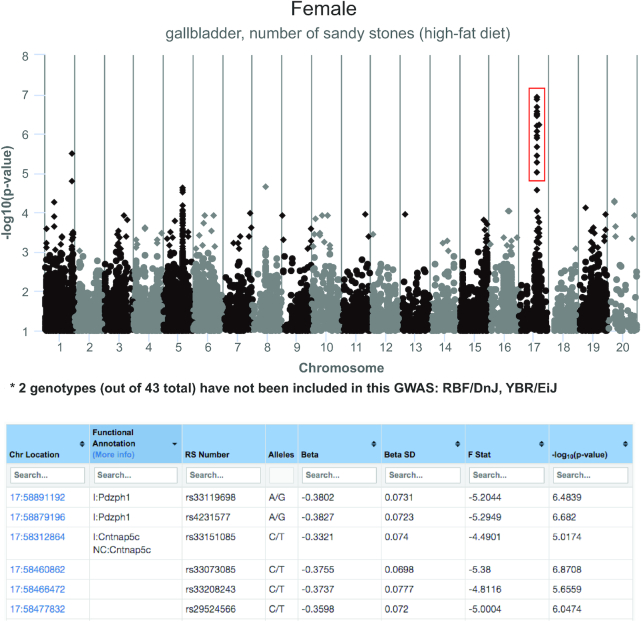
Figure 6.
GWAS tool based on PyLMM. A Manhattan plot of the results is provided (top panel). Data points (SNPs) can be selected (red box) and viewed in a searchable and sortable table (bottom panel). Chromosome, location, dbSNP functional annotation, rs (reference SNP accession) number, alleles and PyLMM output data are available in the table. Users can gather genes or rs numbers in a list to use as input for external research applications.

