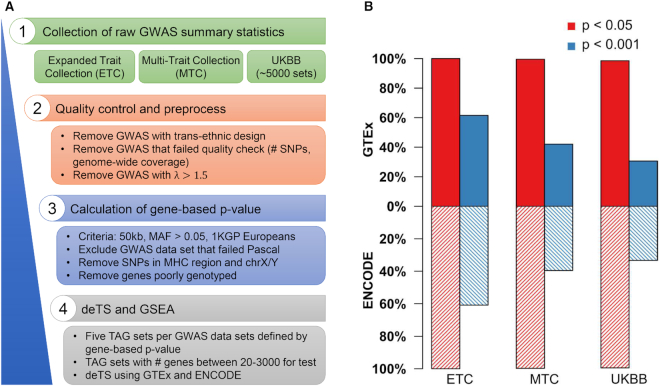
Figure 1.
Data curation and quality control. (A) A pipeline of data quality control process. UKBB: UK Biobank. 1KGP: The 1000 Genomes Project. TAG: trait-associated gene. (B) Comparison of traits with enriched tissues in the GTEx panel and the ENCODE panel. The red and blue bars are plotted using trait–tissue associations defined using deTS P-value < 0.05 and deTS P-value < 0.001, respectively.

