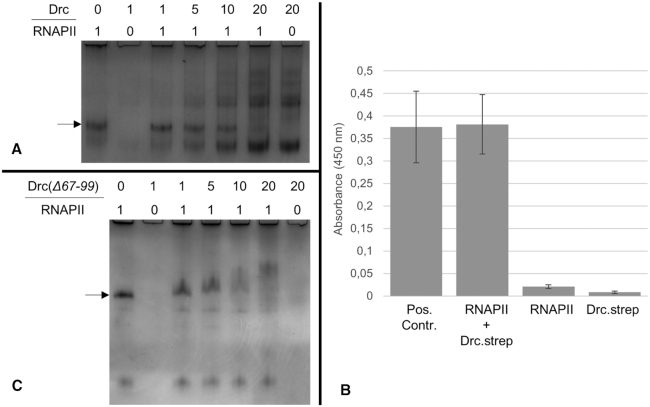
Figure 7.
(A) MSA with Drc and the RNAPII complex on a native 10% acrylamide gel. At the top of each lane the ratio of Drc: RNAPII in each condition is indicated (with 1 being 2.25 μM and 0 being a buffer control). RNAPII was kept constant at 2.25 μM, while the concentration of Drc was increased from left to right. The arrow indicates the height of the RNAPII band in unbound state. (B) ELISA of Drc.strep and the RNAPII complex (with His-tagged RNAP1 subunit) at 100 pmol. The positive control, RNAPII.strep (bar 1) consists of the two RNAPII subunits, of which RNAP1 is His-tagged and RNAP2 strep-tagged. Bar two represents the interaction of RNAPII (only His-tagged at RNAP1 subunit) and Drc.strep at equimolar amounts. Bar three and four are negative controls with respectively Drc and RNAPII replaced by protein buffer. Colorimetric error bars are based on three replicates. detection was done at 450 nm. (C) MSA of Drc(Δ67–99) and the RNAPII complex on a 10% native acrylamide gel. Like in A, the ratios are given at the top of each lane and the arrow represents the unbound RNAPII complex.

