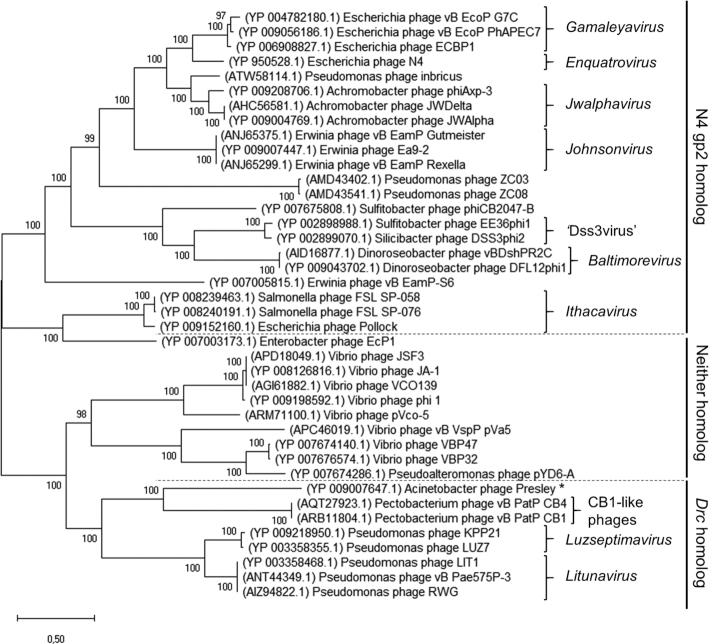
Figure 9.
Evolutionary analysis by Maximum Likelihood, using the vRNAP protein sequences (log likelihood –174006.59) of the various N4-like phages in the dataset of Buttimer and colleagues (31). Taxonomically assigned groups are indicated by brackets with their corresponding genus in italics. The proposed group of ‘Dss3virus’ and suggested group of CB1-like phages are also indicated. Dashed lines delineate the phages that have N4 gp2 homologs, Drc homologs or neither of these two proteins. Phage Presley is indicated with asterisk as it's putative Drc homolog fell under the threshold of significance (Supplementary Table S3). Bootstrap values indicated at each branch point are derived from 1000 replicates.

