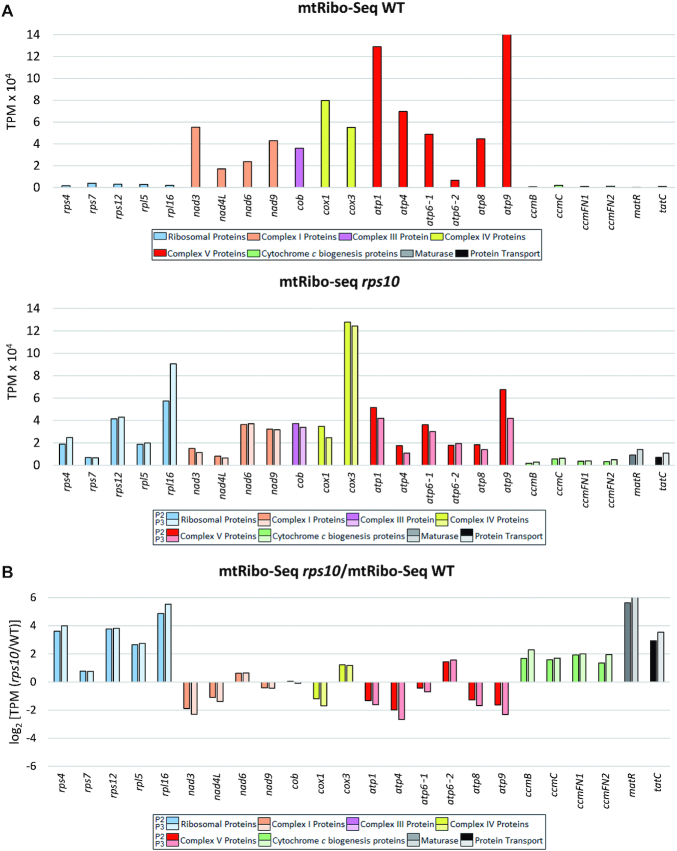
Figure 6.
Translational output of intronless mitochondrial genes in P2 and P3 phenotypes of rps10 and wild-type. Translational output is defined as mtRibo-seq TPM (reads per kilobase per million reads mapping to CDS). Genes are divided into groups as in Figure 5. (A) Translational output in wild-type (top) and rps10 (bottom). (B) Relative translational output in rps10 compared with WT. Log2 of the ratio is shown.

