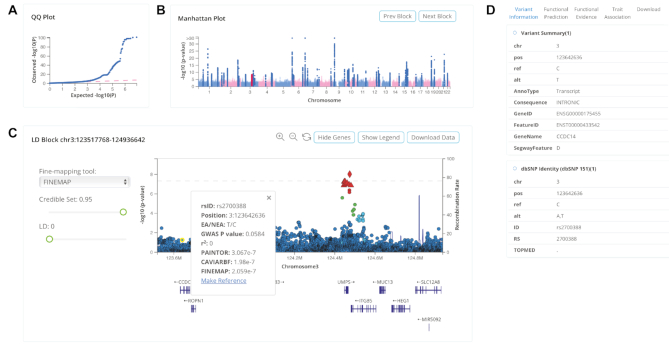
Figure 3.
Causal block viewer in CAUSALdb. (A) QQ plot of selected GWAS. (B) Manhattan plot of selected GWAS, with highlighted blocks that are clickable. (C) LocusZoom-like plot of the selected causal block from Manhattan plot. (D) Functional annotation panel of a selected variant in LocusZoom-like plot.

