Figure 2.
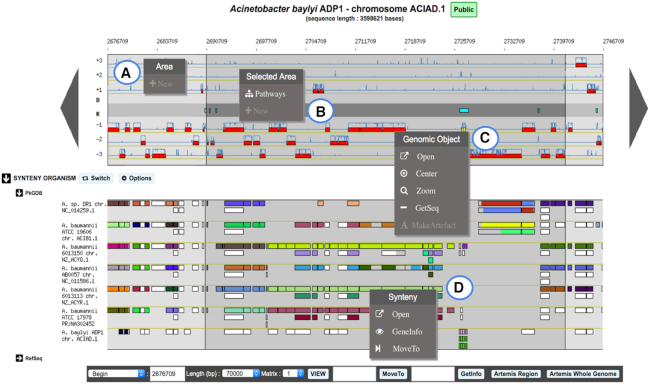
Overview of MicroScope Genome Browser. A 70-kb chromosomal segment from Acinetobacter baylyi ADP1, starting at position 2676709, is represented on this graphical map of the MicroScope Genome browser. Annotated CDSs are represented in the six reading frames of the sequence by red rectangles, and coding prediction curves (blue curves) are superimposed on the predicted CDSs. The central part of the viewer, colored in gray, separates the reverse strand of the DNA sequence from the direct one. It displays repeat regions as well as non-coding genomic objects (e.g. tRNA, rRNA, misc_RNA) according to their strand. The synteny maps, calculated on a set of selected genomes, are displayed below the genome viewer (here on seven genomes from MicroScope PkGDB database). New contextual menus in the genome browser allow users: (A) to create a new genomic object; (B) to list the KEGG metabolic pathways for which enzymes are encoded in a highlighted region; (C) to access shortcuts to perform different actions on a specific genomic object: open the gene editor, center or zoom the view around this object, get its nucleic and protein sequences or annotate it as an artefact; (D) to explore synteny conservation in other species: open the synteny viewer, get gene information on a homologous gene, move the genome browser to the corresponding region of the compared genome.

