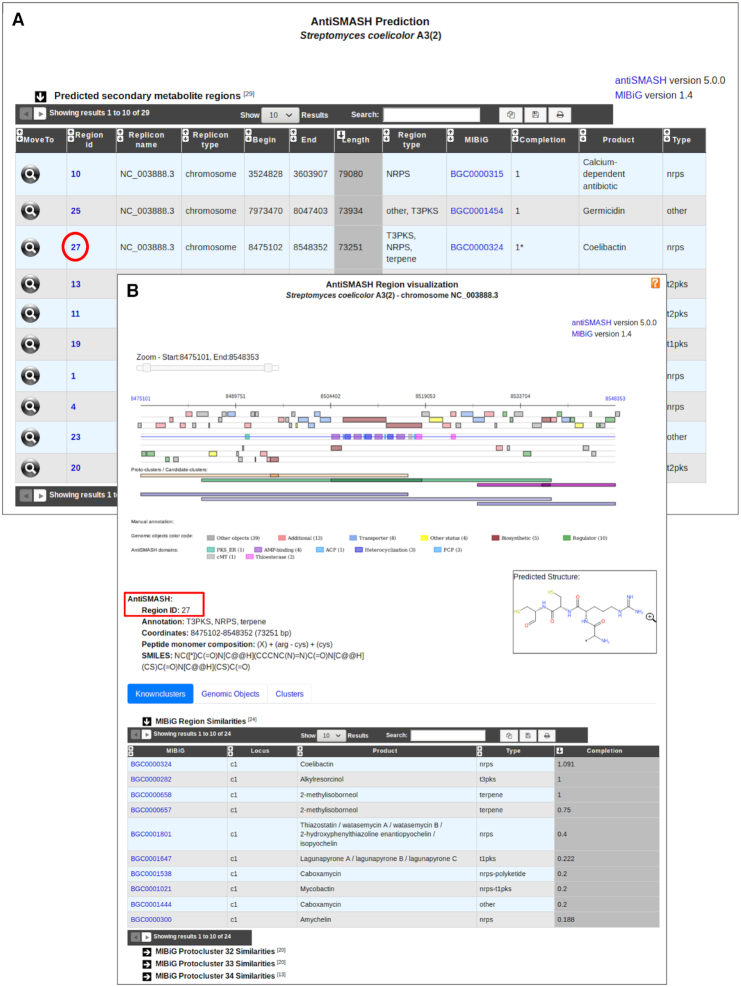
Figure 3.
MicroScope ‘Secondary metabolites’ functionality. BGC predictions for an organism can be accessed from the ‘Secondary metabolites’ section of the ‘Metabolism’ menu. It gives access to a table summarizing BGC region predictions for all replicons of a studied organism (panel A). Here, we see the list of regions predicted by antiSMASH 5 in Streptomyces coelicolor A3(2). The closest known cluster from the MIBiG database is indicated for each prediction if any. All individual predictions can then be explored by clicking on the cluster numbers. An example is shown on the panel B for the region number 27. Biosynthetic genes found in the region are colored in brown and their domain composition is indicated as well. Putative transporter and regulator genes are highlighted in blue and green, respectively. Three protoclusters of three different types have been defined in this region: T1PKS (orange), NRPS (green) and terpene (purple). Each of them is associated with a candidate cluster drawn in blue. Basic region characteristics are indicated below the visualization section such as proposed antiSMASH annotation and coordinates. In case of NRPS/PKS BGC type, the peptide monomer composition is indicated with the corresponding chemical structure encoded in SMILES. The ‘MIBiG Region Similarities’ table indicates similarities with known clusters and the completion value. Here, the NRPS (coelibactin), T3PKS (alkylresorcinol) and terpene (2-methylisoborneol) known clusters are retrieved with high completion values.

