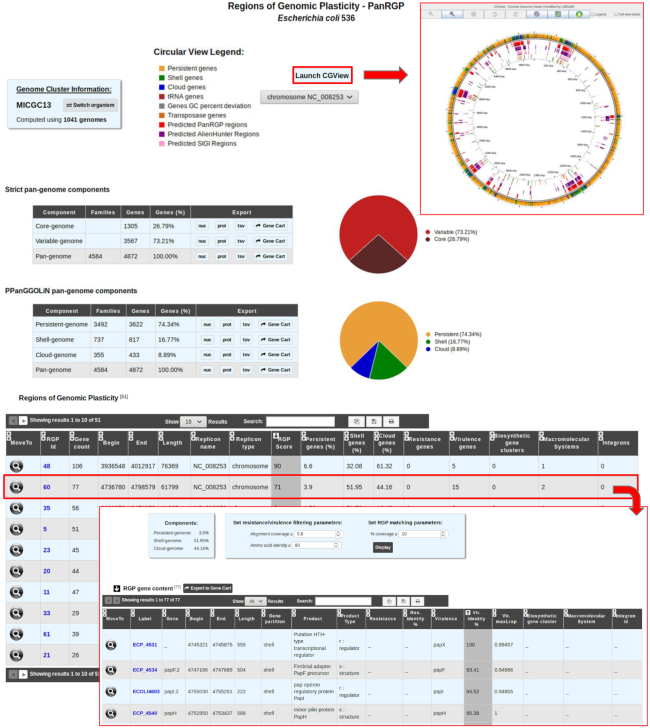
Figure 5.
Detection of RGP with PanRGP tool. RGP predictions for a genome can be accessed from the ‘Pan-genome RGPs’ section of the ‘Comparative Genomics’ menu (here for Escherichia coli 536). In the genome cluster information panel, the number of genomes of the same MICGC (i.e. species) that were used to compute the pangenome with PPanGGOLiN is indicated. Users may switch to the predictions for another strain using ‘Switch Organism’ button. The ‘Strict pan-genome components’ table represents a summary of the exact core/variable analysis whereas the ‘PPanGGOLiN pan-genome components’ table gives the number of genes and MICFAM families for each PPanGGOLiN partition. Users can extract all this data in fasta files (nucleic and protein), tab-separated values (tsv) files containing the annotations or in a gene cart for further analysis. By clicking on the ‘Launch CGView’ button, it is possible to browse the genes along the genome in a circular representation based on CGView with information about their PPanGGOLiN partition and the RGP locations. The table ‘RGP’ lists all predicted RGPs with a summary of the number of genes involved in antibiotic resistance, virulence, biosynthetic clusters, macromolecular systems and integrons. By clicking on a RGP identifier, a page provides a detailed list of the genes within the selected RGP and a list of similar RGPs in other strains (not shown in the figure).

