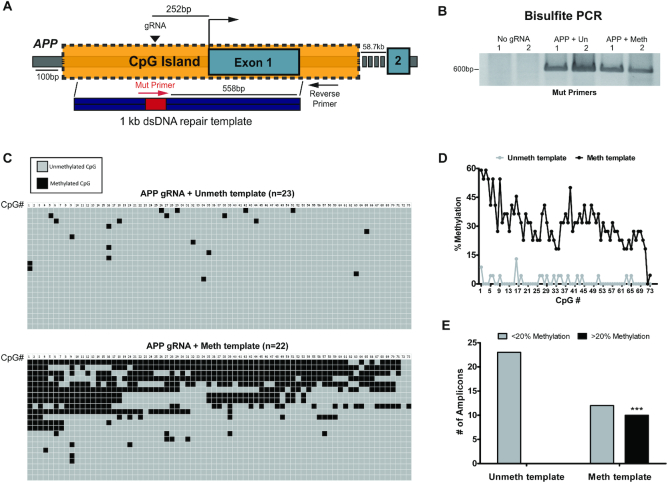
Figure 6.
Targeted DNA methylation of APP. (A) Diagram of APP gene locus showing CpG island, gRNA targeting site (black triangle) and bisulfite primers (Red and black arrows) used to amplify only DNA that incorporates a 12bp mutation (red box) from the template. Figure is drawn to scale, except for primers which are for illustrative purposes. (B) Bisulfite PCR of HEK293T cells transfected with No gRNA plasmid, APP gRNA + unmethylated template or APP gRNA + methylated template. n = 2 biological replicates. Primer location is indicated in (A). (C) Bisulfite sequencing of cloned amplicons from (B). Each column represents a CpG site in the ∼600 bp amplicon. Grey boxes indicate unmethylated cytosines whereas black boxes represent methylated cytosines. n = 23 sequences for APP gRNA+ unmethylated template group and n = 22 sequences for APP gRNA+ methylated template group. (D) Quantification of mean methylation at each CpG site in the amplicon (73 total CpG sites) depicted in (C). n = 23 sequences from unmethylated template group and n = 22 sequences from methylated template group. (E) Number of highly methylated amplicons (>20% methylation) from bisulfite sequencing depicted in (C). n = 23 sequences for unmethylated template group and n = 22 for methylated template group. Ten amplicons are highly methylated in the methylated template group versus 0 amplicons in the unmethylated template group. ***P = 0.0002; Fisher's exact test (two-sided).

