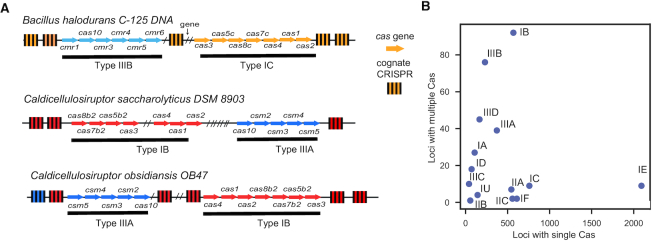
Figure 5.
Association between Cas clusters. (A) Examples of complex CRISPR–Cas loci found in Bacteria. Arrows represent cas genes and cas clusters are coloured by subtypes. Genes that were not identified as cas genes were omitted and replaced by a slash (/). CRISPRs colours match the Cas subtype to which their repeats were assigned. Grey indicates that no subtype could be assigned. (B) Number of loci with a given Cas subtype found in simple or complex loci.

