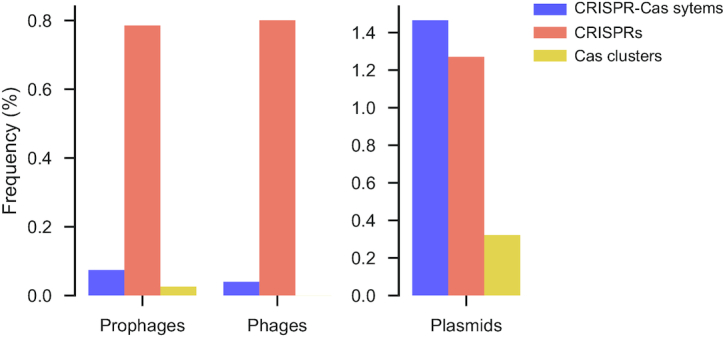
Figure 6.

Frequency of CRISPR–Cas systems in prophages, phages and plasmids. Frequency notes the percentage of such mobile elements encoding at least one CRISPR–Cas system, a cas cluster or a CRISPR. Note that the scales of the axes are different, since CRISPR–Cas are much more abundant in plasmids.
