Figure 3.

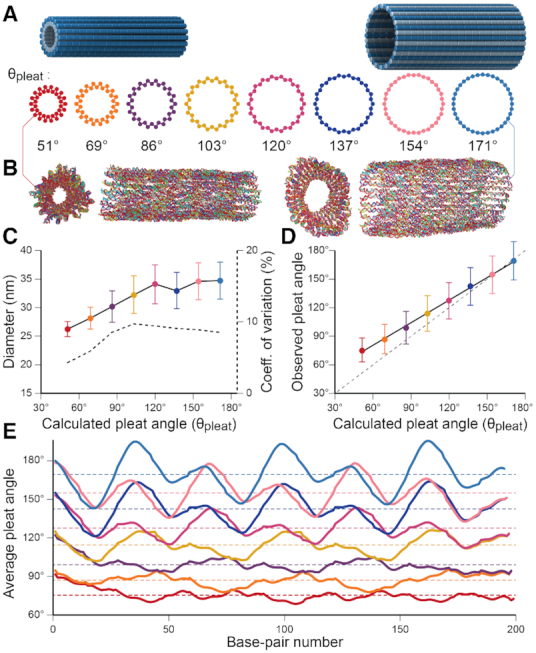
Molecular dynamics simulation of pleated DNA origami nanotubes using oxDNA. (A) Designs for eight 36-duplex nanotubes with a range of pleat angles. 3D models are of nanotubes with a 51° pleat angle (left) and a 171° pleat angle (right) (B) Single-frame images showing end and side views of the 51° pleated (left) and 171° pleated (right) nanotubes. (C) Observed diameters versus designed pleat angle for the 8 designs. Error bars are standard deviation. Dashed line (right axis) indicates coefficient of variation of diameter. Theoretically diameters calculated from idealized models (Supplementary Note 3) are shown in Supplementary Figure S11. (D) Observed average versus designed pleat angles for the with linear fit (solid black line). Dashed line shows equivalent values for reference. (E) Average pleat angle measurements at every base pair location along the length of each nanotube. Dotted lines indicate average pleat angles along the entire length.
