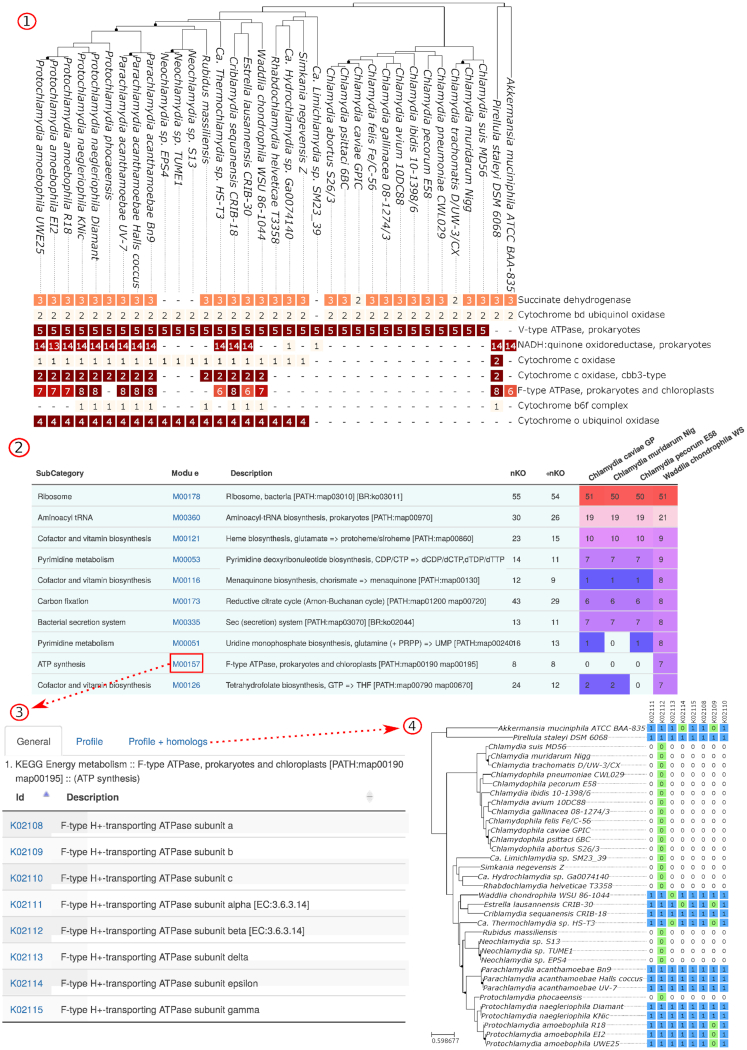
Figure 4.
Comparative analysis of KEGG Pathways and Modules. (1) Comparison of KEGG modules of the ‘ATP synthesis’ category. Numbers indicate the amount of annotated Kegg Orthologs (KO) for each module. We can observe that F-type ATP-synthase subunits were identified in only some species of the phylum and were probably lost independently by Neochlamydia/rubidus strains and Protochlamydia phocaensis. (2) Module data can be browsed as tables. (3) Detailed lists of Kegg Orthologs (KO) can be retrieved from linked pages. (4) The pattern of presence or absence of each KO in each genome of the phylum can also be investigated visually (blue cells) for any module and pathway. Green cells indicate genomes for which no protein was annotated with the corresponding KO but an ortholog was identified based on OrthoFinder data. They could indicate either wrongly annotated proteins or non-orthologous proteins wrongly clustered in the same orthologous group. Panels 1 and 4 present only a subset of the 277 genomes currently present in the database to fit on a single page. Complete figures can be retrieved from the ChlamDB website.

