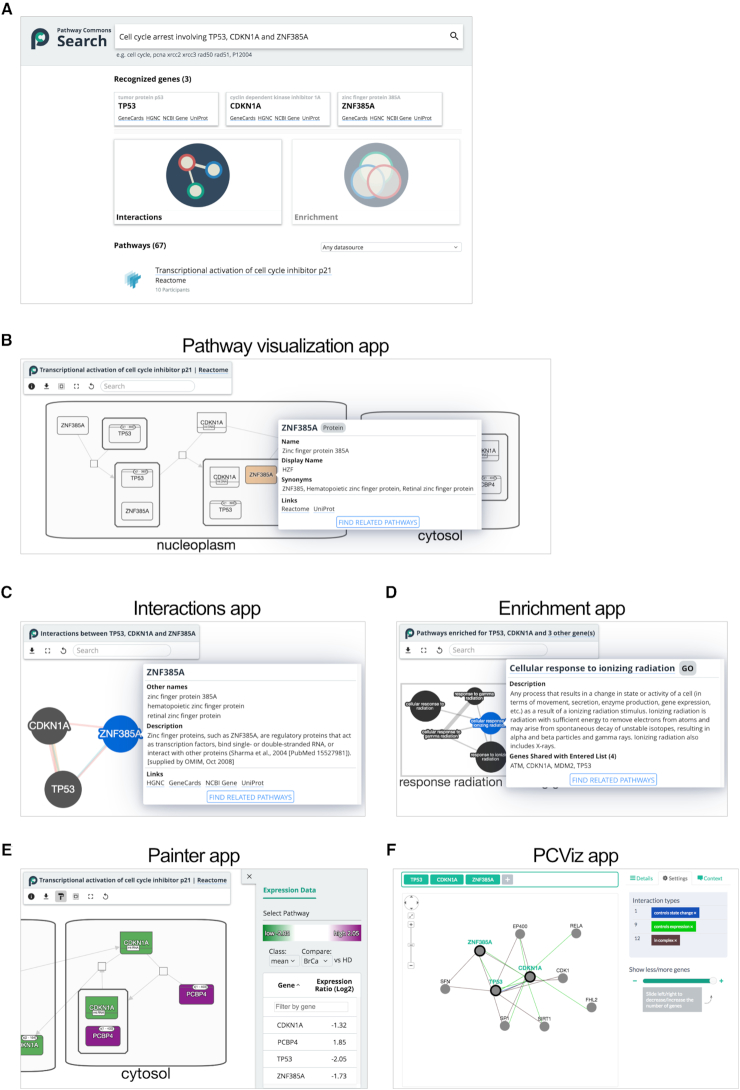
Figure 3.
Pathway Commons web apps. (A) Search provides integrated access to the entire collection of pathways and interactions in Pathway Commons. User queries are analyzed to select the type of search results they may find most useful, such as mentions of recognized genes along with link-outs to web apps and a ranked list of pathway search hits. (B) Each pathway search hit is linked to an interactive viewer, rendered using the Systems Biology Graphical Notation (SBGN) visual language. (C) The Interactions web app accessed from the search page links to an interactive network visualization showing relationships between one or more of genes recognized in a user query. (D) With longer lists of recognized genes, an Enrichment web app links to results of pathway enrichment analysis displayed as an interactive Enrichment Map network. Nodes represent pathways (GO: Biological Process, Reactome pathways) and edges connect similar pathways, as measured by the number of shared genes. All visualization features are built using the Cytoscape.js software library. (E) The Painter app, launched via the Enrichment Map app for Cytoscape desktop (not shown), projects quantitative gene expression data onto pathways. (F) A PCViz app accepts one or more query genes and displays a network of interactions between and around it.

