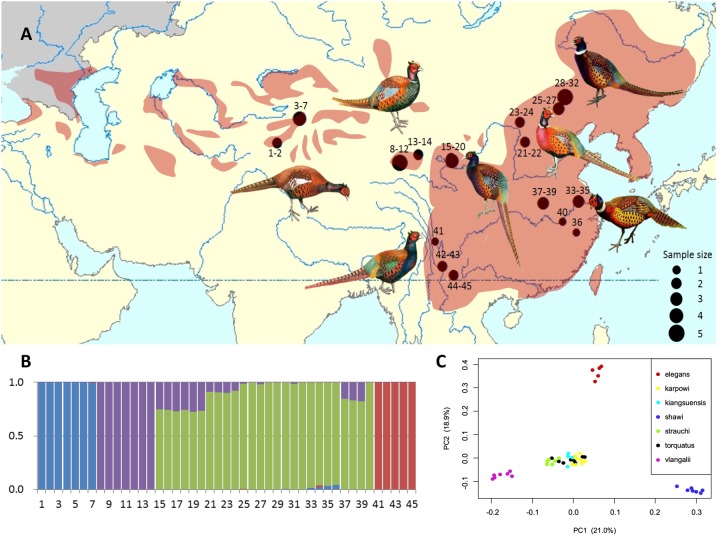
Fig. 1.
—Population genetic structure of common pheasant in China. (A) The distributions of samples of seven subspecies of common pheasant. Shown are males with divergent phenotypes (pheasant artworks were modified from Pfarr 2012). The size of the circles is proportional to the number of individuals. (B) Four genetic clusters were inferred by ADMIXTURE using 4,376,351 SNPs. The Y-axis represents the proportion of each ancestral genetic component and numbers in the X-axis represent sample locations (details in supplementary table S5, Supplementary Material online) and seven subspecies affinities: 1–7: shawii; 8–14: vlangalii; 15–20: strauchi; 21–24: kiangsuensis; 25–32: karpowi; 33–40: torquatus; 41–45: elegans. (C) Principal component analysis (PCA) of 45 individuals from seven subspecies of common pheasant using the same SNP data set with ADMIXTURE analysis. Color dots represent individuals of different subspecies.

