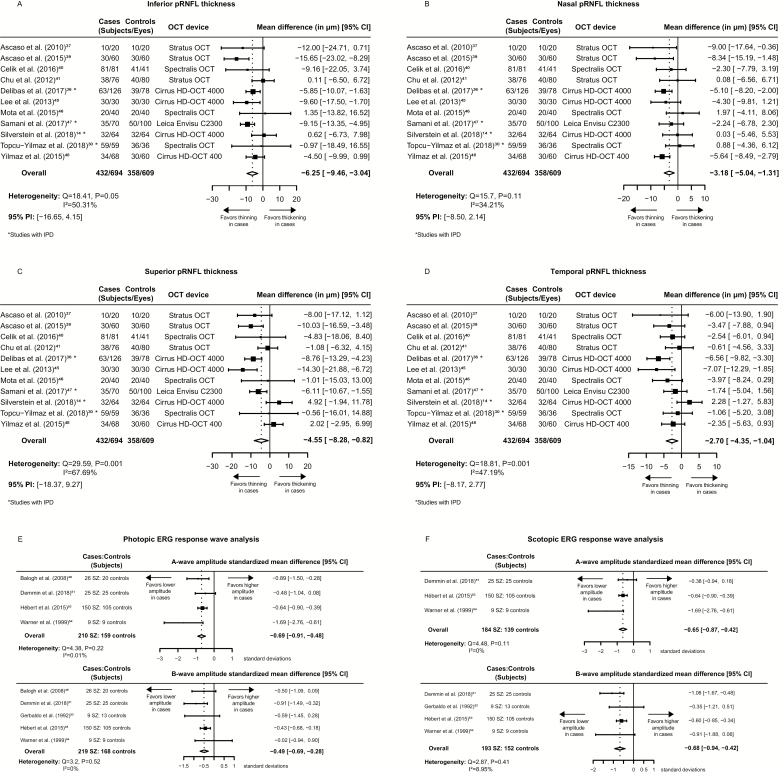
Fig. 2.
Mean differences of pRNFL measurements and standardized mean differences of ERG measurements between schizophrenia cases and controls. (A) inferior quadrant pRNFL thickness, (B) nasal quadrant pRNFL thickness, (C) superior quadrant pRNFL thickness, (D) temporal quadrant pRNFL thickness, (E) photopic ERG response wave analysis, (F) scotopic ERG response wave analysis. 95% CI, 95% confidence interval; 95% PI, 95% prediction interval; SZ, schizophrenia subjects; OCT, optical coherence tomography; ERG, electroretinography; pRNFL, peripapillary retinal nerve fiber layer; IPD, individual participant data; HD, high definition.

