Figure 2.
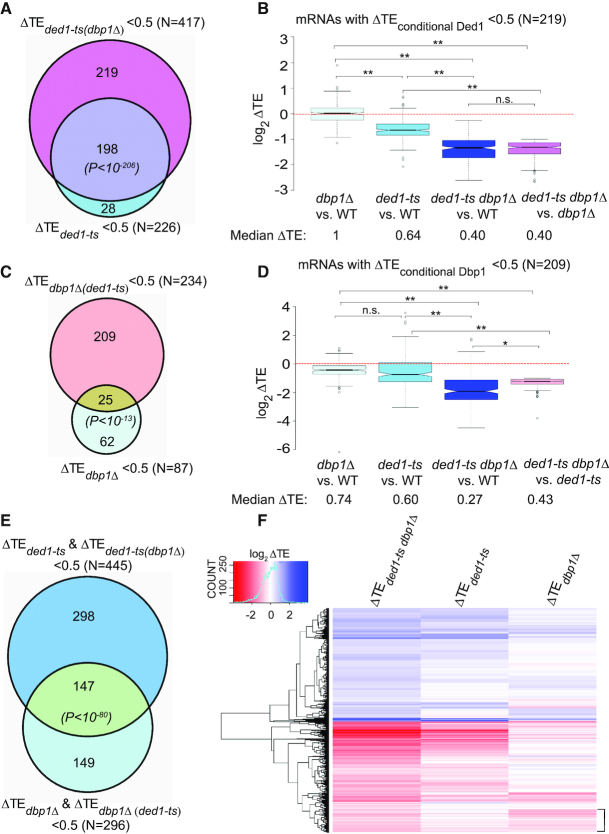
Dbp1 functionally cooperates with Ded1 in regulating the yeast translatome. (A) Venn diagram of overlap between mRNAs exhibiting ≥2-fold TE reductions in response to ded1-ts in otherwise WT or dbp1Δ strains. P values for significance of overlap are based on the hypergeometric distribution. (B) Notched box-plot analysis of 219 ‘conditionally Ded1-hyperdependent’ mRNAs, defined in ‘Results’ section, comparing TE changes observed in the four indicated comparisons. (C) Venn diagram of overlap between mRNAs exhibiting ≥2-fold reductions in TE on DBP1 deletion in a WT or ded1-ts strain. (D) Similar to (B), but for 209 ‘conditionally Dbp1-hyperdependent’ mRNAs, defined in ‘Results’ section. In (B) and (D), P-values from Mann–Whitney U-test are indicated (*, P< 10−11; **, P< 10−16; n.s., not significant). (E) Venn diagram of overlap between 445 mRNAs exhibiting ≥2-fold reductions in TE conferred by ded1-ts in either WT or dbp1Δ cells and a set of 296 mRNAs exhibiting ≥2-fold reductions in TE conferred by dbp1Δ in either WT or ded1-ts cells. (F) Hierarchical clustering analysis of ΔTE values conferred by ded1-ts, dbp1Δ or ded1-ts dbp1Δ versus WT for 1957 mRNAs with significant TE changes in ded1-ts dbp1Δ versus WT cells (FDR < 0.05), presented as a heatmap. Ten mRNAs with >64-fold changes in TE were excluded because they would diminish color differences among the remaining mRNAs. Bracket includes mRNAs with TEs reduced much more by dbp1Δ versus ded1-ts (col. 3 versus 2).

