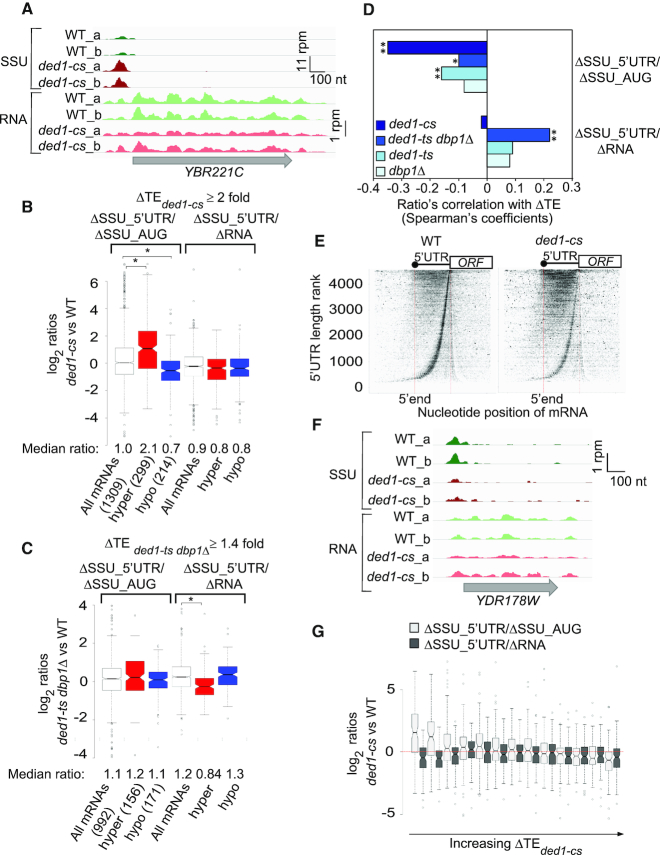
Figure 7.
SSU profiling reveals functional cooperation between Ded1 and Dbp1 in stimulating PIC attachment and scanning in vivo. (A) SSU and mRNA reads on the Ded1-hyperdependent mRNA YBR221C in two biological replicates each (_a, _b) of WT or ded1-cs cells in units of rpm (reads per million mapped reads), with the position of the CDS shown (gray arrow) below the tracks, revealing accumulation of SSUs in the 5′-UTR in ded1-cs versus WT cells. Depicted using Integrated Genomics Viewer (Broad Institute). (B andC) Notched box-plots showing distributions of the log2 ratios ΔSSU_5′-UTR/ΔSSU_AUG (cols. 1–3) or ΔSSU_5′-UTR/ΔRNA (cols. 4–6) for all mRNAs (white) and those exhibiting TE decreases (hyper, red) or TE increases (Hypo, blue) exceeding 2-fold in ded1-cs versus WT cells (B), or 1.4-fold in ded1-ts dbp1Δ versus WT cells (C), both at FDR < 0.05. Median ratios for each group are below the x-axis, and numbers of mRNAs in each group are in parenthesis. Results from Mann–Whitney U-test are shown only for comparisons with significant P-values (*, P< 10−10). (D) Spearman coefficients from correlations between the ratios ΔSSU_5′-UTR/ΔSSU_AUG (top 4 bars) or ΔSSU_5′-UTR/ΔRNA (bottom 4 bars) versus ΔTE values (measured by 80S profiling) conferred by the indicated mutation versus WT, for all mRNAs yielding data in both analyses, ranging from ∼900–1300 mRNAs. (*, P< 10−3; **, P< 10−16). (E) Plot showing shift in SSU densities from start codon into 5′-UTRs in ded1-cs cells (right) versus WT cells (left). All mRNAs annotated with a 5′-UTR (37) were ranked according to 5′-UTR length (vertical axis) with longest 5′-UTRs at the top. SSU footprint 5′-end positions are plotted (horizontal axis), and were scaled to the 5′-UTR length such that the 5′-end and start codon of all transcripts are vertically aligned (solid and dotted red lines, respectively). (F) As in (A) but for Ded1-hyperdependent mRNA YDR178W, exhibiting reducd SSUs in the 5′-UTR in ded1-cs versus. WT cells. (G) Notched box-plots showing distributions of the ΔSSU_5′-UTR/ΔSSU_AUG ratios (light gray boxes) or ΔSSU_5′-UTR/ΔRNA ratios (dark gray boxes) across all mRNAs sorted into 13 bins (100 genes each) on the basis of increasing ΔTEded1-cs from 80S profiling, with the 300 most Ded1-hyperdependent mRNAs falling in bins 1–3.

