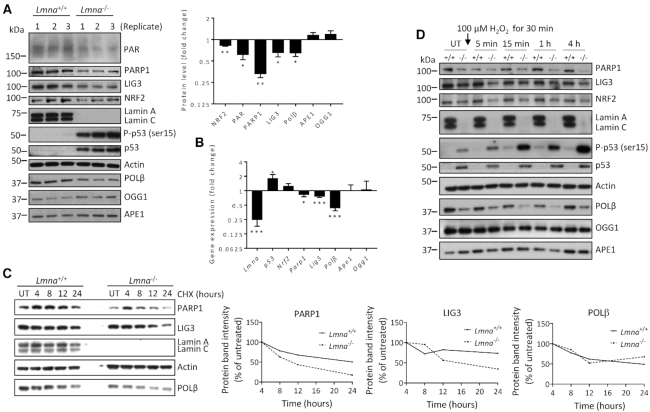
Figure 3.
The expression and stability of specific BER-associated proteins are reduced in Lmna−/− MEFs, relative to Lmna+/+ MEFs. (A) Western blotting was performed on MEF lysates prepared in three separate experiments. Band intensities were quantitated using ImageJ. Bars represent the mean intensity of the proteins bands displayed as fold change in Lmna−/− MEFs (relative to Lmna+/+ MEFs) (n = 3, mean ± SEM). Band intensities of p53 and p-p53 (ser15) from Lmna+/+ MEF lysates were too low for quantification. (B) Real-time qPCR was performed on the indicated genes, in three separate experiments, displayed as fold change in Lmna−/− MEFs (relative to Lmna+/+ MEFs) ± SEM. (C) Cycloheximide chase assay. Cycloheximide (CHX) was added to the MEFs at a concentration of 50 μg/ml and cells collected for lysate preparation (and western blotting) at the indicated time points. (D) Western blotting was performed on lysates prepared from the Lmna+/+ and Lmna−/− MEFs that were either untreated (UT) or exposed to 100 μM H2O2 for 30 min, and left to repair for the indicated times in fresh medium. P values were determined by Student’s t-test; ***P < 0.0001; **P < 0.005; *P < 0.05; +/+, Lmna+/+; -/-, Lmna−/−.

