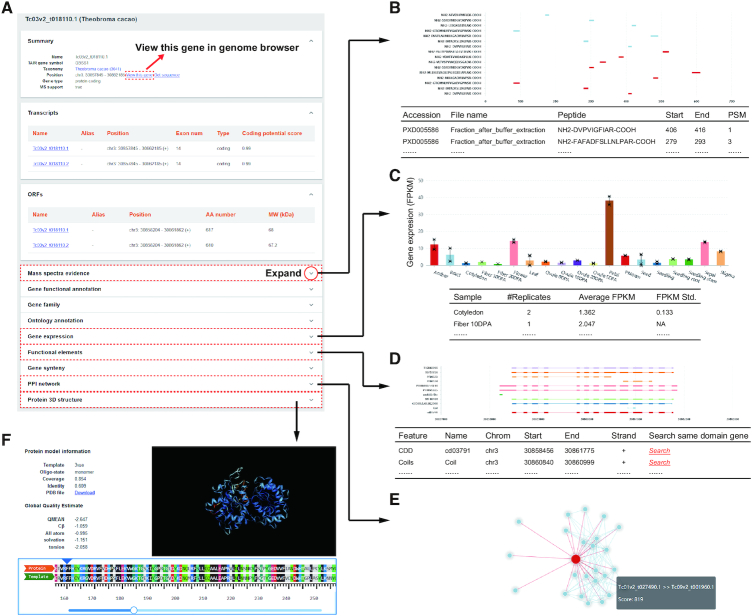
Figure 2.
Functional annotations in GeneWiki. (A) Different types of functional annotations in GeneWiki page. (B) Custom figure and table showing the positions and details of MS evidence for a protein. (C) Bar plot and table showing the gene expression level in FPKM across different tissues. (D) Custom dynamic charts and tables of functional elements annotated for a protein. (E) An interactive view of the PPI network for the query protein. (F) Dynamic visualization of the predicted 3D structure and the model details for a protein.

