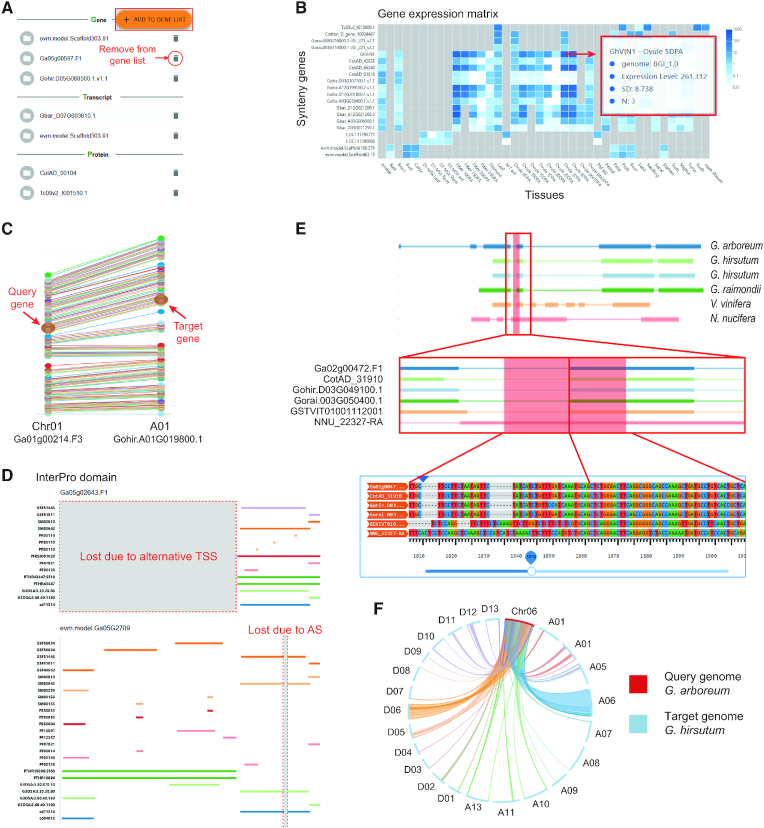
Figure 4.
Comparative genomics tools in MaGenDB. (A) Management of gene list of interest for comparative analysis. (B) Gene expression heatmap across different tissues for collinear genes to a query gene from the GeneWiki page. (C) Genomic position mapping of collinear genes. (D) Comparison of functional domains between two proteins. Grey box marks the missing region in one vs the other. (E) An interactive view of multiple alignments of collinear genes from the gene structure perspective. (F) A circular view of the gene synteny clusters between G. arboreum Chr06 with G. hirsutum chromosomes.

