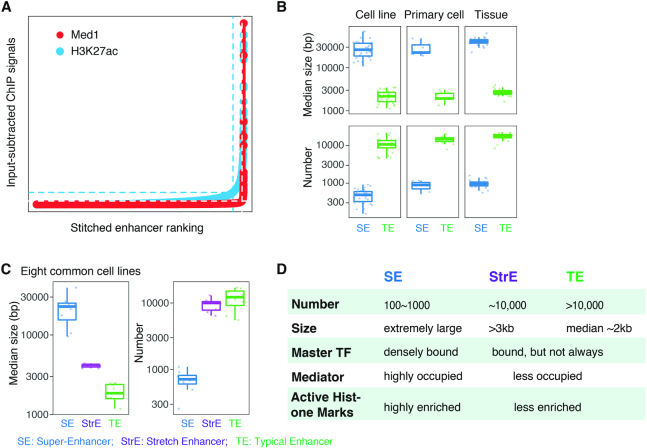
Figure 1.
Identification and characteristics of super-enhancers. (A) Call of SEs with MED1 or H3K27ac ChIP-seq data, using ROSE algorithm which takes into account enhancer ranks and ChIP signals (6). Y-axis gives input-subtracted MED1 or H3K27ac ChIP-seq coverage, and x-axis shows the rank of ‘superness’ based on the value given on y-axis. Dashed lines in both directions indicate the cutoffs for separating SEs from typical enhancer. (B) Box-plots comparing the median size (upper) and the number (bottom) between SEs and typical enhancers (TEs) in 30 cell lines, 11 primary cells and 24 tissues available from the ENCODE project. (C) Box-plots comparing the median size (left) and the number (right) of SEs, stretch enhancers (StrEs), and typical enhancers (TEs) in eight selected cell lines. (D) Characteristic summary of SEs, in comparison to stretch enhancers (StrEs) and typical enhancers (TEs).

