Figure 3.
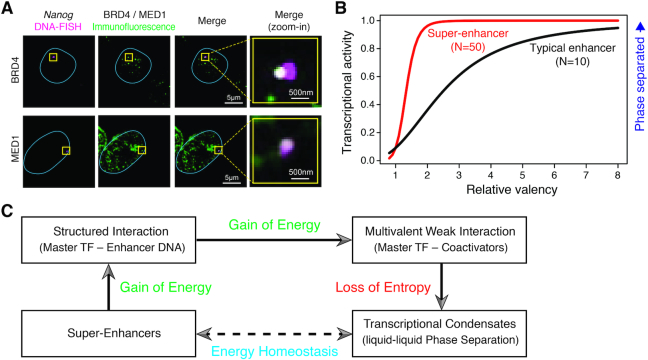
Phase-separated transcriptional condensates at super-enhancers. (A) Immunofluorescence and DNA-FISH showing the co-localization between BRD4 or MED1 condensates (magenta) and the Nanog gene locus (green) in fixed mouse ESCs. The blue lines indicate the nuclear boundaries, and the overlapping signal in the merged channels is shown in white (figure was adapted from (39) with permission from AAAS). (B) Theoretical curves showing the dependence of transcriptional activity on the increase of valency for SEs (parameterized as N = 50 molecules) and typical enhancers (N = 10) based on a phase-separation model proposed by Sharp et al. (50). While SEs reach a high transcriptional activity at relatively low valency, typical enhancers need higher valency to achieve the same transcriptional activity (figure was adapted from (50) with permission from Elsevier). (C) A schematic chart showing the energy homeostasis in formation of LLPS at SEs. Structured Interaction and multivalent interaction occur, providing energy to compensate the loss of entropy when LLPS forms and the system gets ordered.

