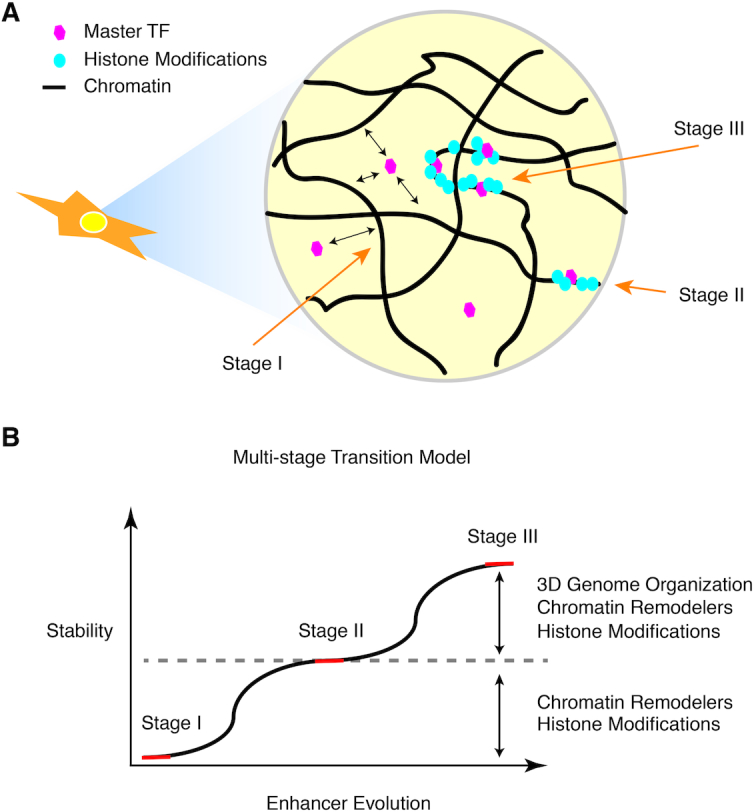
Figure 5.

Multi-stage transition model of super-enhancer formation. (A) A schematic cartoon showing different stages of SE formation. Stage I: dynamic binding of the master TF; Stage II: accumulation of histone modifications and other TFs and stabilization of typical enhancers; Stage III: convergent evolution of synergistic typical enhancers to form SEs. (B) A diagram showing the process of enhancer evolution, represented in (A). Red line indicates the steady states while the black curve indicates the transition stages. Note that earlier stages are less stable than later stages where the enhancer is becoming larger in size and stronger in various protein binding signals and histone biochemical modifications.
