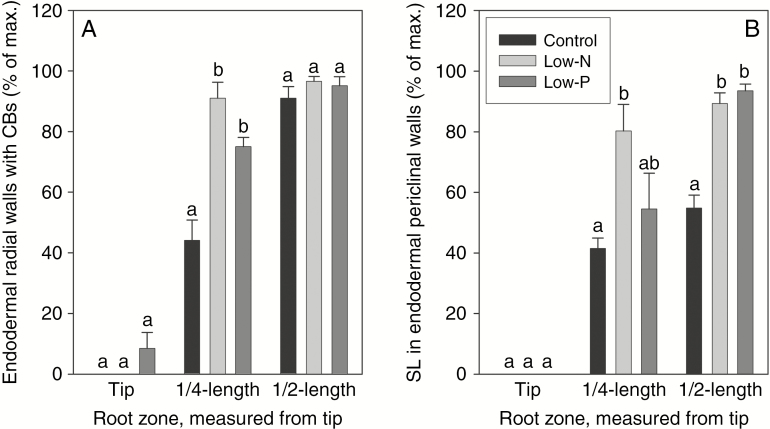
Fig. 8.
Semi-quantitative assessment of the occurrence of (A) fully formed Casparian bands (CBs) and (B) suberin lamellae (SL) in the main axis of seminal roots of 14- to 18-d-old barley plants. Plants were grown on complete nutrient solution (control) or on nutrient solution containing only 3.33 % of the nitrogen (low-N) or 2.5 % of the phosphate (low-P) of the control solution. Sections were made at three positions along the identical root for a given treatment. Results are means and s.e. (error bars) of four or five root analyses and are expressed as percentage of the maximum possible value if all endodermal cells contained fully formed Casparian bands (i.e. not merely a dot-like appearance of Casparian band structure but a fully-formed band along the entire radial wall of an endodermal cell) and suberin lamella (with staining at highest intensity). Statistically significant differences (P < 0.05) in values between treatments are indicated by different letters above the columns

