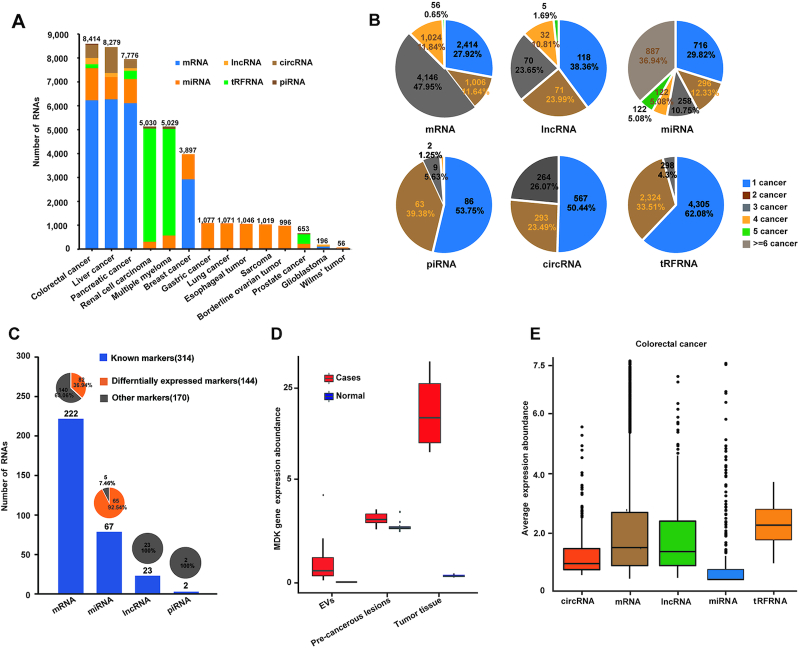
Figure 3.
Systematical screening of potential blood biomarkers. (A) A bar chart showing the differentially expressed RNAs between tumor blood samples and normal blood samples in various cancer types. (B) A pie chart showing the number of differentially expressed genes shared by different cancers. (C) A bar chart showing the known biomarkers with higher expression in tumor blood samples compared to normal blood samples. (D) MDK expression was higher in blood samples of liver cancer patients compared to blood samples of normal persons (fold change >1.5, adjusted P-value < 0.05). (E) A box plot showing the expression abundances of five different RNA types in colorectal cancer blood samples.

