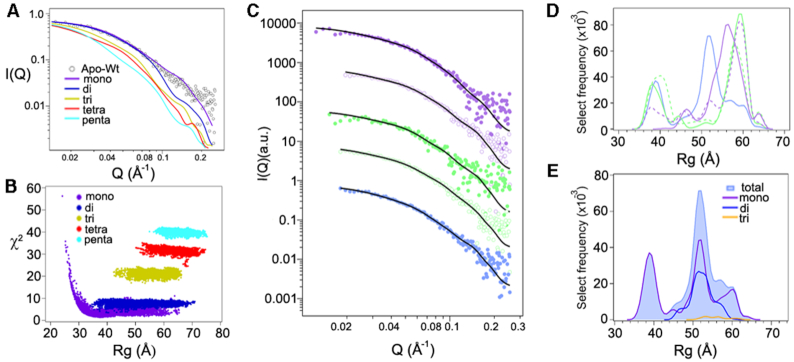
Figure 2.
Apo-DnaA is a mixture of different oligomer states. (A) SAXS curve for Apo-DnaA (open circles) compared to the lowest discrepancy (χ2) values for each oligomeric form, distributed among monomer to pentamer forms (solid lines). (B) Comparison of discrepancy (χ2) to Rg values for the best conformers (≤2000 conformations constructed per oligomer) to fit the experimental SAXS data obtained for Apo-DnaA. (C) SAXS data (circle) for each oligomeric form present within the Apo-DnaA sample were calculated using flexible-oligomer model and overlaid by corresponding fits (solid lines) on each curve. The curves were shifted in decade increments for better visualization and matched for the color sequences as in Figure 1. (D) Histograms of total select models versus Rg for the different oligomeric DnaA states. The color sequences were matched with (C). (E) Histogram of Apo-DnaA total select models versus Rg. The histograms for each contributing oligomer were also plotted for comparison.

