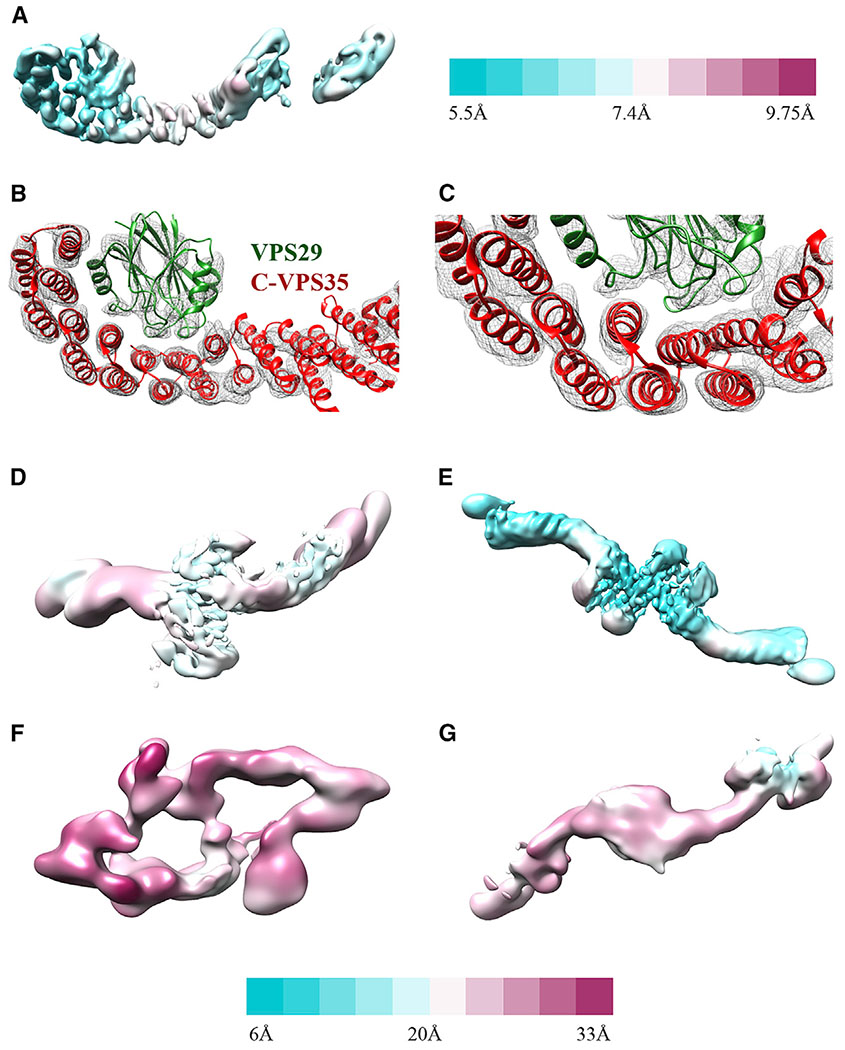
Figure 3. Local Resolution and Features.
(A) Retromer heterotrimer resolution range across the model with legend shown to right (5.5–9.8 Å).
(B) View of C-VPS35/VPS29 interface to show model fitting into α helices (contoured at 6σ).
(C) Close-up view of VPS35 C-terminus to show model fitting into α helices (contoured at 6σ).
(D–G) Resolution range for dimer (D); VPS35-centered chain I interface (E); tetramer (F); and VPS26-centered chain II interface (G). Legend shown below from 6 (cyan) to 33 (magenta) Å.

