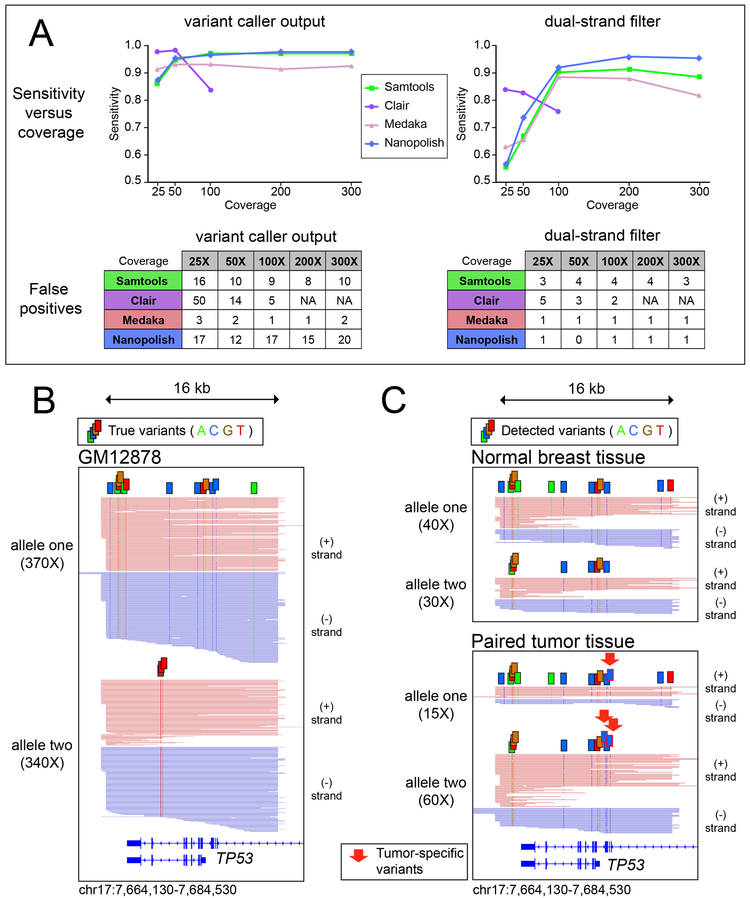
Figure 2 -. Single Nucleotide Variants.
(A) Plot of sensitivity versus coverage using four tools to call single nucleotide variants from enrichment data in GM12878 for a 140kb region containing 174 annotated SNVs (B) Visual representation of high-confidence variants detected by nanopolish in the MinION data from GM12878 for the captured region around TP53, reads phased into homologous alleles using WhatsHap. (C) High-confidence variants identified in primary tissue from a tumor/normal pair, red arrows used to demarcate tumor-specific variants.

