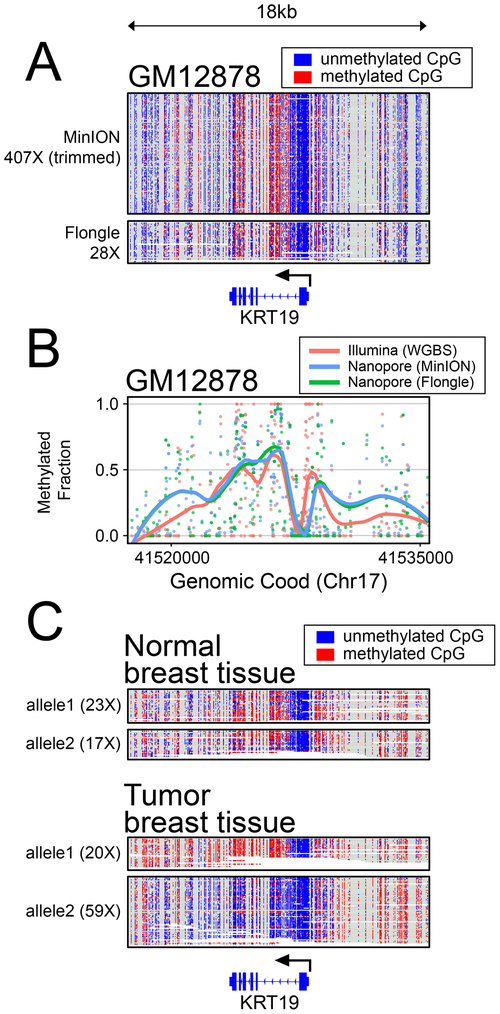
Figure 3 -. Methylation Analysis.
(A) Read-level plots showing methylation patterns in GM12878 from minION and flongle data at the KRT19 locus. (B) Methylation calls (points) and line plots at the same locus as in (A) showing smoothed (loess) methylation calls from whole genome bisulfite sequencing on the Illumina platform7, compared with methylation calls from minION and flongle targeted nanopore sequencing. (C) Haplotype phased methylation calls in primary patient tissue and paired tumor at the KRT19 locus.

