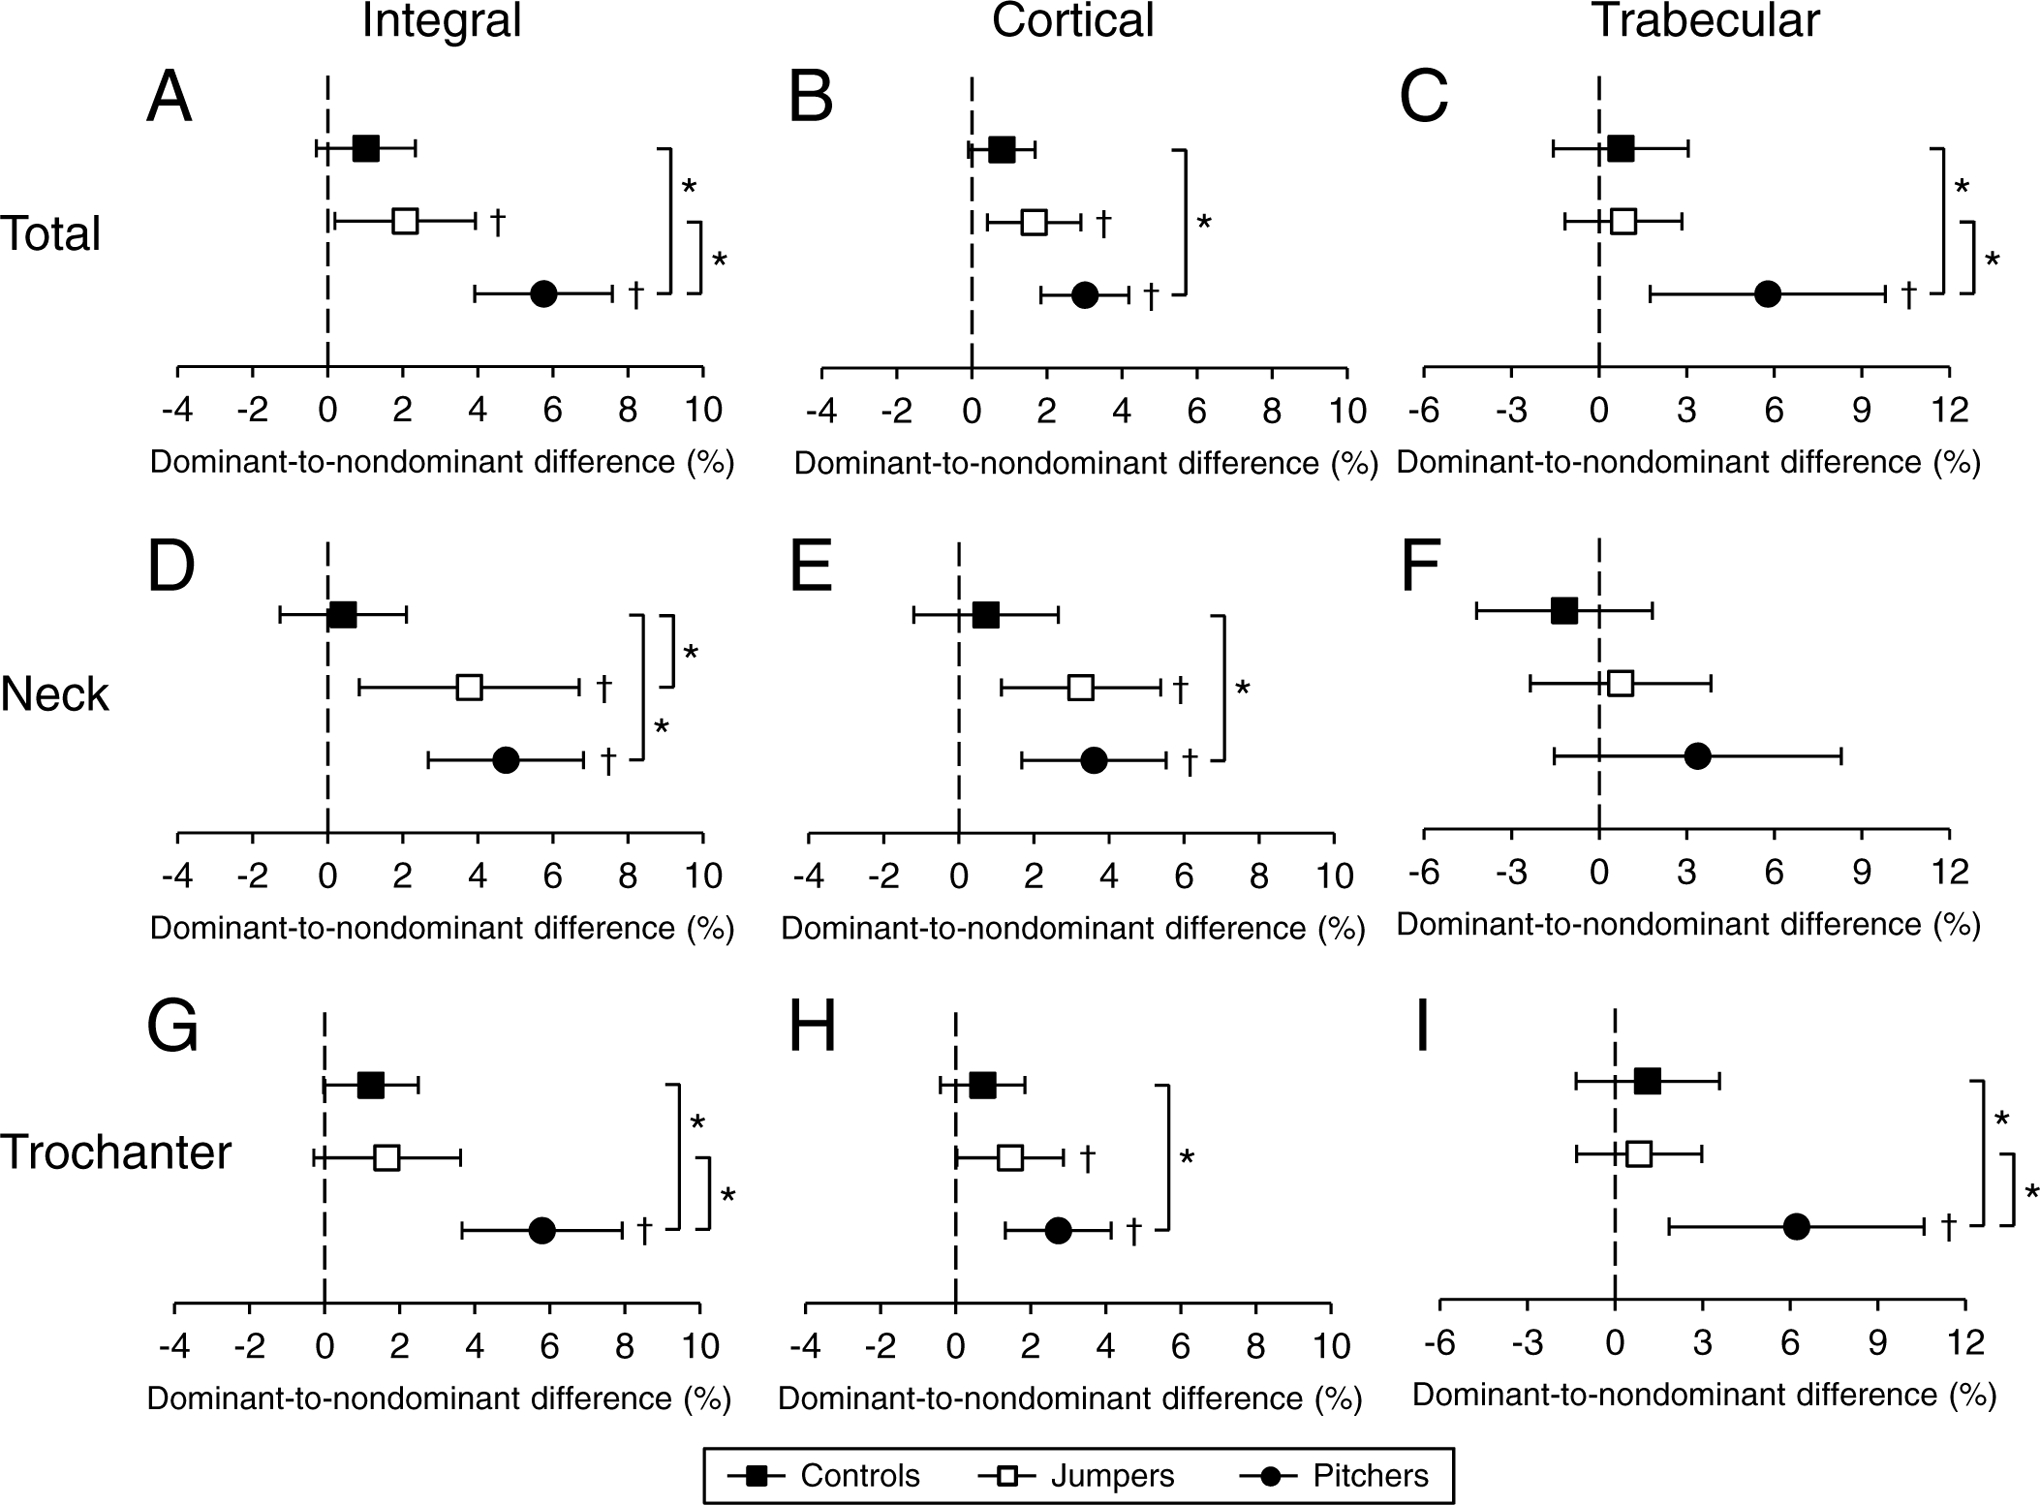
Figure 1.

Percent dominant-to-nondominant leg differences for integral (i.e. cortical + trabecular), cortical and trabecular vBMD in the total proximal femur (A-C), femoral neck (D-F), and trochanter (G-I) regions. Data represent mean percent difference between the dominant and nondominant legs, with error bars indicating 95% confidence intervals. Confidence intervals greater than 0% (†) indicate greater bone properties within the dominant leg compared to nondominant leg. *indicates p < 0.05 for between group comparison.
