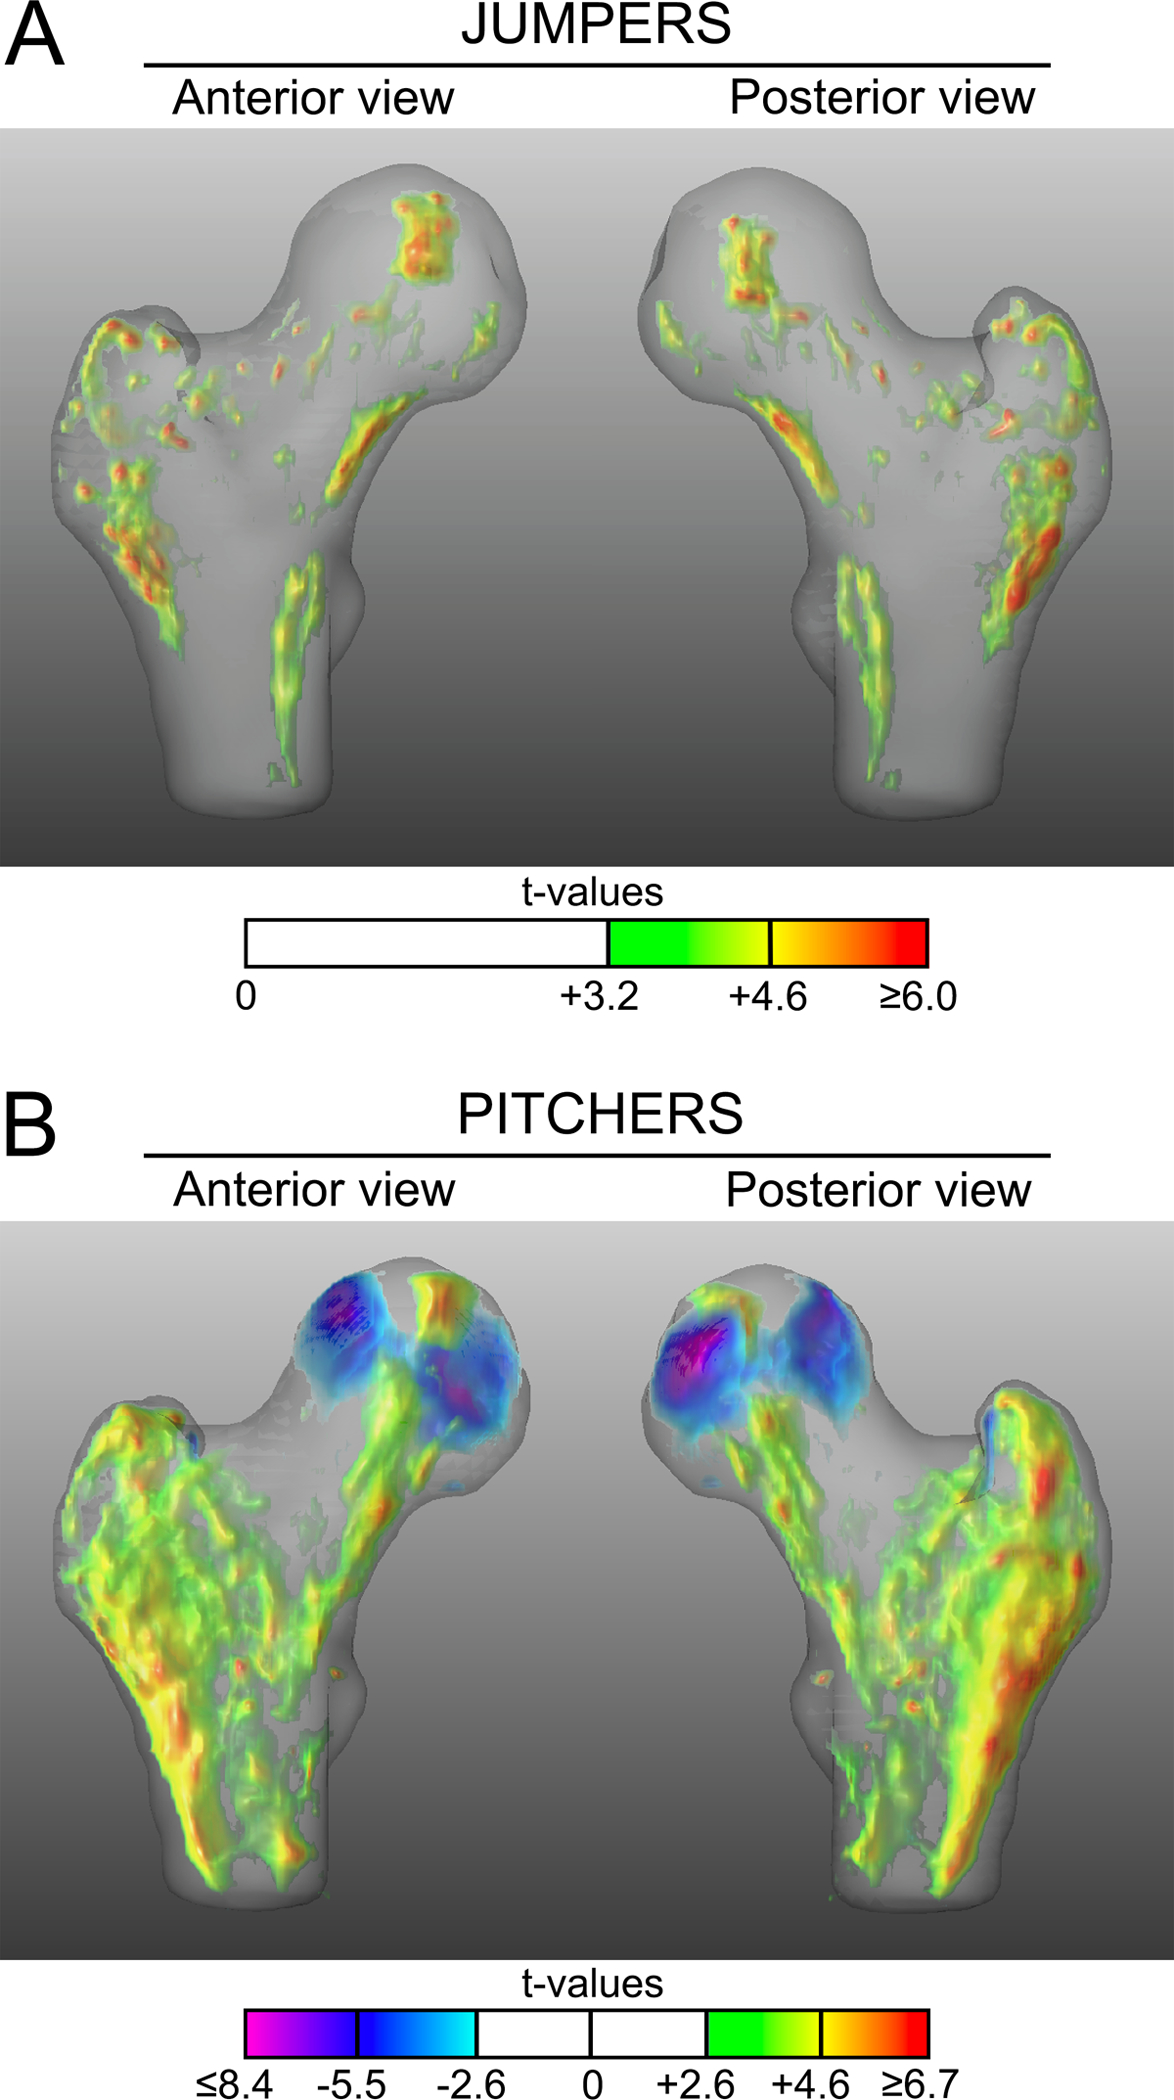
Figure 2.

Anterior and posterior views of the 3D t-map showing voxel-wise differences in vBMD between the dominant and nondominant legs in jumpers (A) and pitchers (B). Voxels with positive and negative t-values indicate significantly higher and lower vBMD in dominant legs compared to contralateral nondominant legs, respectively. Voxels where there were no statistical differences between dominant and nondominant legs are rendered transparent.
