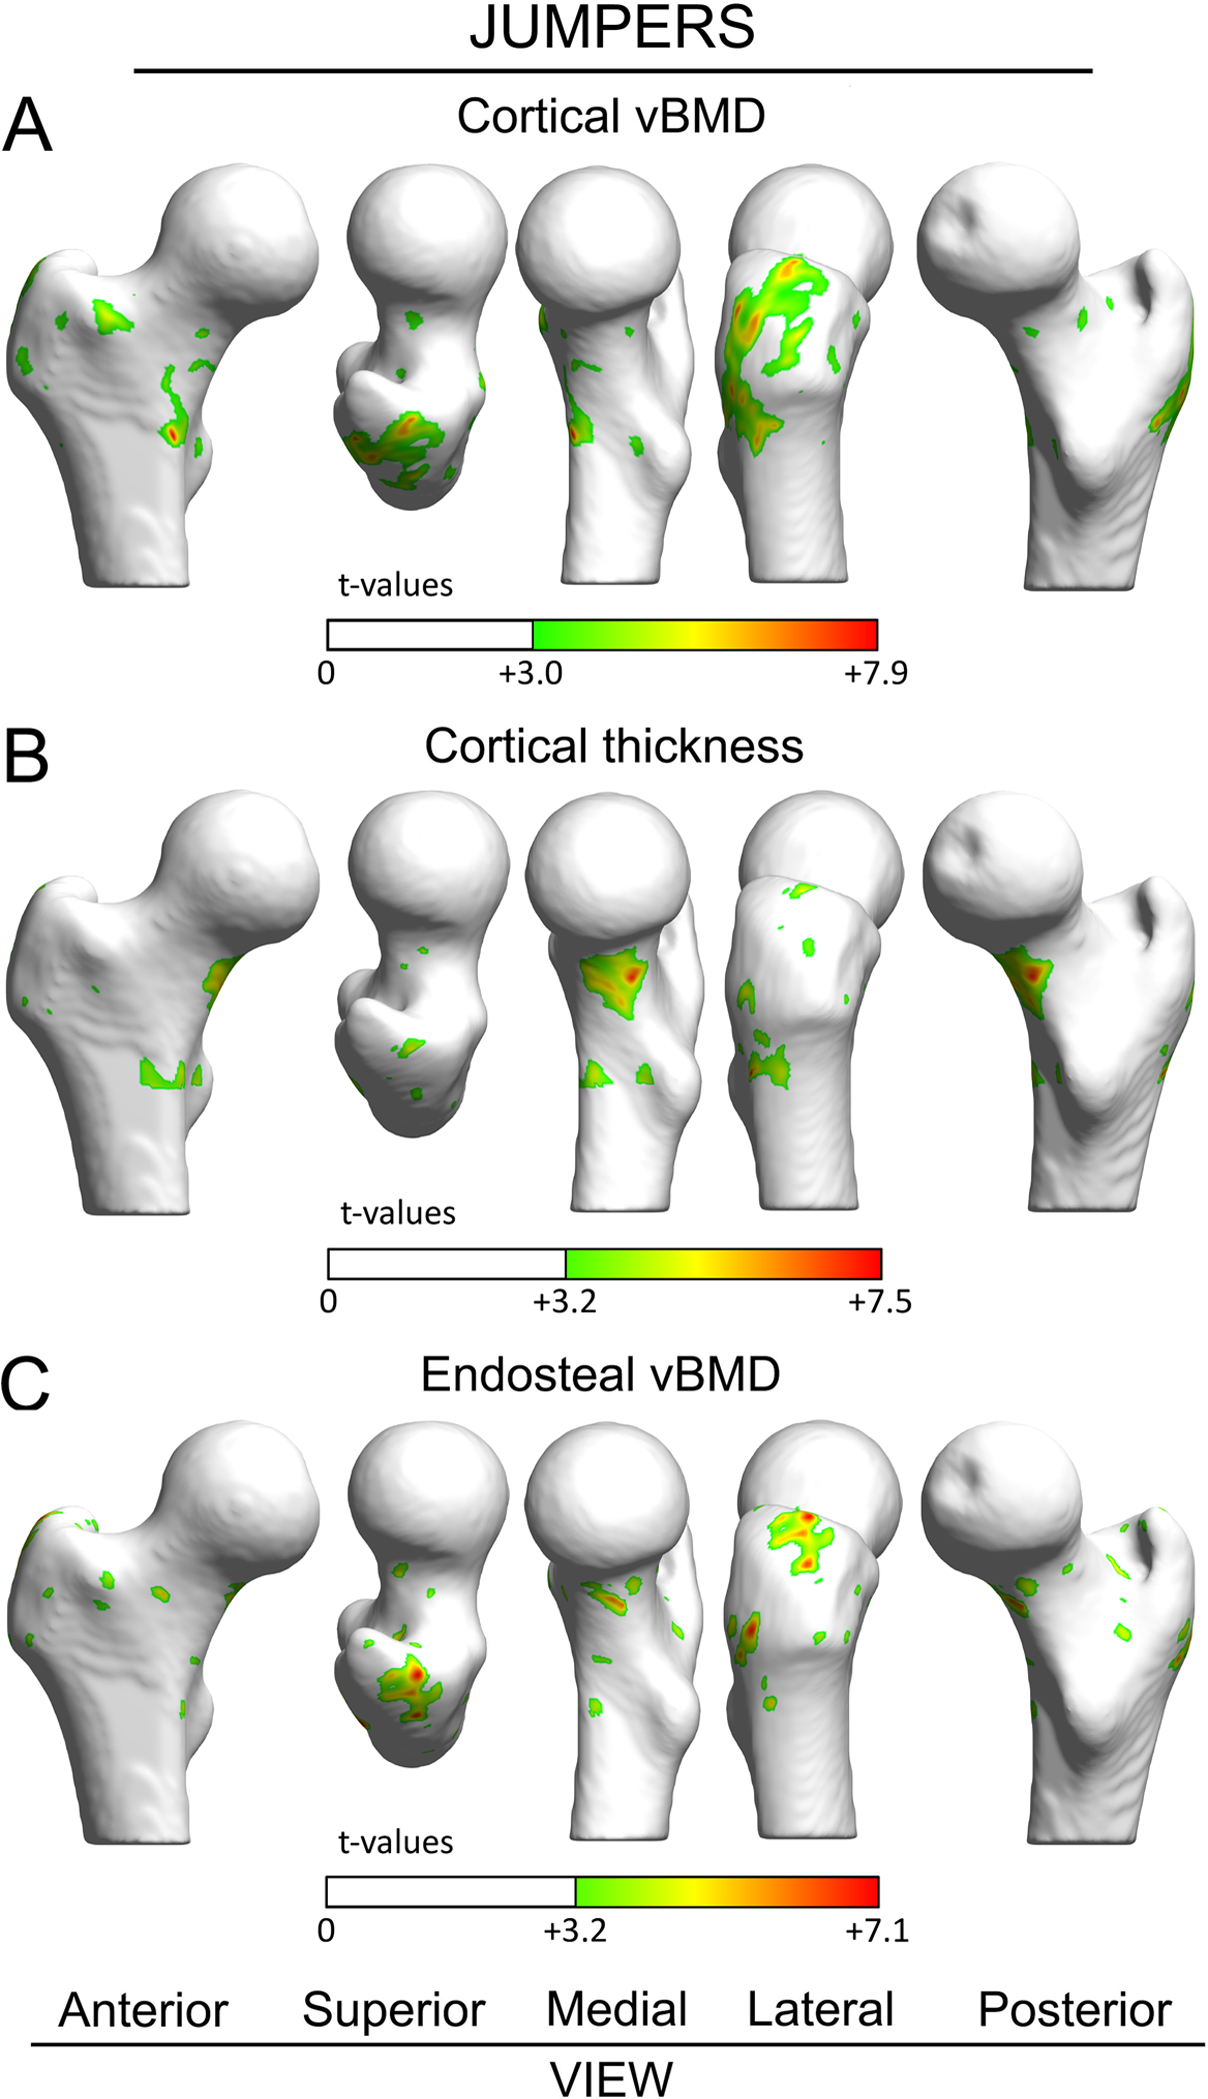
Figure 3.

Surface-based maps of vertex-wise differences between dominant and nondominant legs in jumpers for cortical vBMD (A), Ct.Th (B), and EndoTb.vBMD (C). Vertices with positive t-values indicate significantly greater properties within dominant legs compared to contralateral nondominant legs. Vertices where there were no differences between dominant and nondominant legs are rendered white. The femoral head was excluded from the analyses due to its thin cortical bone.
