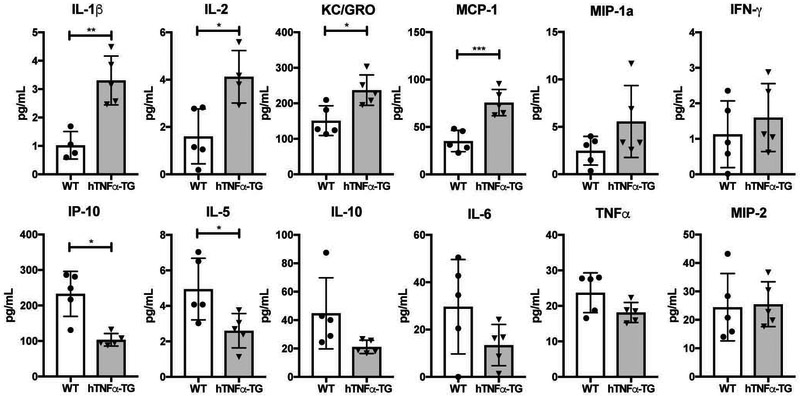
Figure 1: Circulating cytokine levels in hTNFα-TG mice showed an overall increase of inflammatory markers compared to WT controls.
IL-1β, IL-2, KC/GRO, and MCP-1 show a significant increase in concentration in the hTNFα-TG mice. IP-10 and IL-5 both show a significant decrease in the hTNFα-TG mice. Scatter plots show all data points plotted as mean ± SD. t-test was used to determine significance between groups. (n = 5) * p ≤ 0.05, ** p ≤ 0.01, *** p ≤ 0.001.

