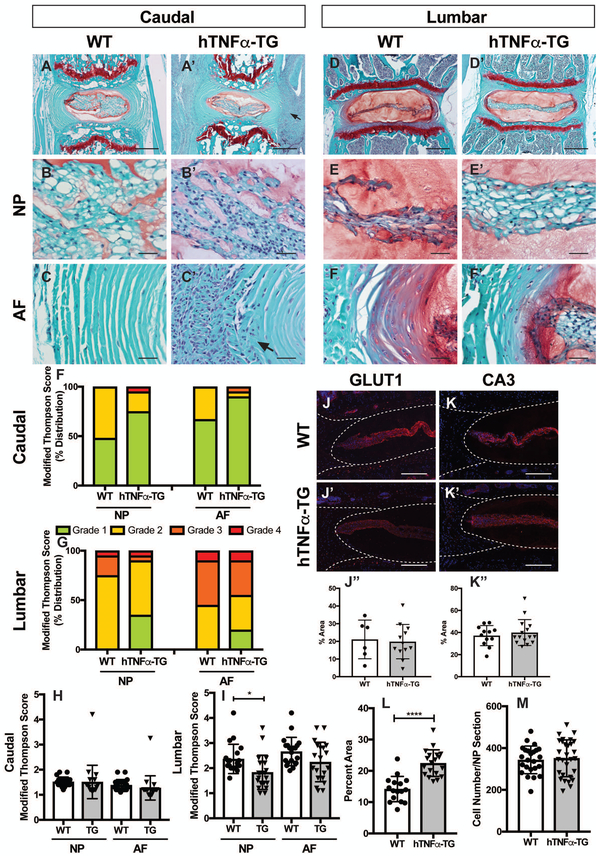
Figure 3: TNFα transgenic lumbar discs are healthier than wild type controls, but the caudal annulus fibrosus shows cell infiltration of the outer lamellae.
(A-F’) Safranin O/Fast Green/Hematoxylin staining of coronal sections of WT and hTNFα-TG mouse intervertebral discs (A, A’, D, D’; scale bars = 200μm; B-C’ and E-F’, scale bars = 20μm). (F, G) Distribution of histological grades of (F) caudal and (G) lumbar discs using the modified Thomson scale. (H, I) Average modified Thompson scores for (K) caudal and (L) lumbar intervertebral discs of 9-month-old WT and hTNFα-TG mice. (J-K”) Representative images and quantification showed similar expression of NP cell markers glucose transporter 1 (GLUT1) (n=4; 1–2 levels per animal for WT, n = 5; 3 levels per animal for hTNFα-TG)(J-J”) and carbonic anhydrase 3 (CA3) (n=5; 3 levels per animal) (K-K”) in WT and hTNFα-TG lumbar discs (J-K’; scale bar = 200 μm). (L) The area occupied by the NP cell band in lumbar discs is significantly larger in the hTNFα-TG animals. However, the NP compartment showed comparable cell number between WT and hTNFα-TG mice (M). Histological grading data was collected from 4 caudal and 4 lumbar discs per mouse (n=5 mice/genotype). Scatter plots show all data points and plotted as mean ± SD. Significance was determined using ANOVA and Sidak’s multiple comparison test. * p ≤ 0.05, **** p ≤ 0.0001.

